So I'm just incredulous, looking at the graph of declining use, thinking "This cannot be. There are ever more ***holes clogging up my street and town and local highways and state and nation and world than ever before".

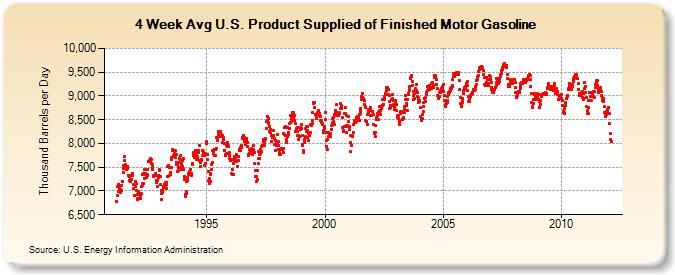
THIS U.S. Energy Information Administration graph looks different:
 4-Week Avg U.S. Product Supplied of Finished Motor Gasoline (Thousand Barrels per Day)
Are they measuring the same thing? Does one have imports/exports and one not?
It has dropped since '08, but only to '00 levels. Step back and the curve undeniably has relentlessly gone up. We are in a dip... will it continue?