Quote:
Originally Posted by redpoint5

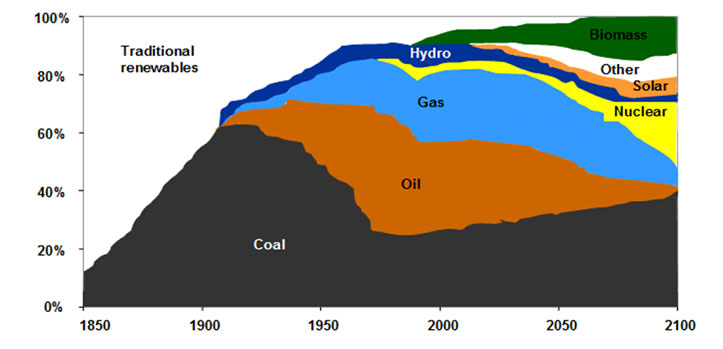
Why would hydro decrease? If anything, it should remain the same or slightly increase.
|
I thought the same thing until I realized that this chart is showing each source as a PERCENTAGE of the TOTAL primary energy for any given year, whatever that total might have been. It doesn't show the absolute value. So the big dip in coal as Britain's supplies started to run out, and after we found oil, is just the portion or share that coal was contributing. The overall total energy use, and coal use, was still sky rocketing. As it is projected to continue to 2100. Making hydro look less. And solar to look stalled. But it is just less percentage of a much larger whole. Even if it's absolute value is still increasing. I couldn't find a better chart that calculated absolute values by year for the entire world. Most are by country and only show out to 2040.
.
.
.
.