05-29-2020, 06:18 AM
|
#1 (permalink)
|
|
Banned
Join Date: Nov 2017
Location: Australia
Posts: 2,060
Thanks: 107
Thanked 1,605 Times in 1,136 Posts
|
Flow over upper surfaces and lift
I forgot I had this shot, taken where I was looking down a little on the tufted Jaguar.
Notice there's no separation on the upper surfaces at all from nose to tail, except for a tiny amount at the base of the rear windscreen.

Measured pressures:
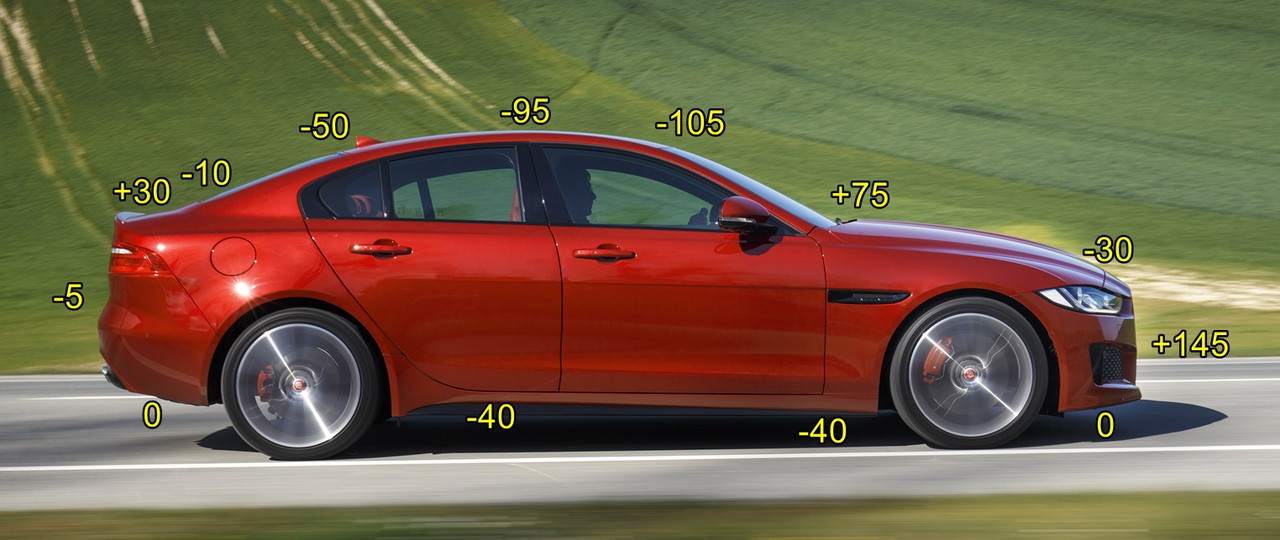
Once you get a feel for it, it's one area in car aero where, if there's attached flow, you can be pretty confident where there will be low and high pressures - and also make a good guess at their relative values (on the upper surfaces, anyway).
Incidentally, look at how low the pressures are above and below the car, compared to the wake pressure.
|
|
|

|
|
The Following User Says Thank You to JulianEdgar For This Useful Post:
|
|
 Today Today
|
|
|
|
 Other popular topics in this forum...
|
|
|
|
|
05-29-2020, 08:38 AM
|
#2 (permalink)
|
|
Cyborg ECU
Join Date: Mar 2011
Location: Coastal Southern California
Posts: 6,299
Thanks: 2,373
Thanked 2,172 Times in 1,469 Posts
|
The tufts and the pressure readings visualize what is happening on the surface of the car. Add a third visualization. Wind tunnel smoke trails can help tell the story of what is happening in the area above the tufts.
Wind tunnel smoke trail pics are usually taken for promotion and they love to maneuver the wand to create bowing arches of gentle beauty. But the EM thread of wind tunnel and smoke trails has some shots that tell a messier story of the roof.
On this somewhat older Mercedes red dramatically highlights the vortices beginning to grow at the windshield header.

On this Caddy (more like your jag), the trail in the flow also begins to show vortices and breakup just behind the windshield header. It is less dramatic but you can see the growing disturbance of the smoke begin just behind the windshield header.
In this light, your pressure readings confirm the possibility that vortices are beginning to develop across your jag's roof just behind the windshield header. Your pressure readings show that pressure begins to return before reaching the point of greatest roof camber (from -105 to -95 ) and continues to climb after (‐50, -10, +30). That story of rising pressure in the flow is associated with the story of growing vorticity seen in the smoke trails.
And all the while the tufts would be pasted flat even across parts of the very messy rear window and trunk. Take for example my tufts from my Civic. They look smoother than expected after 45 mph 7 years ago when I took this shot. The vortices off the c pillars and the downwash from the roof are doubtlessly more turbulent than on the sides or the roof but the tufts can barely tell that story.
__________________
See my car's mod & maintenance thread and my electric bicycle's thread for ongoing projects. I will rebuild Black and Green over decades as parts die, until it becomes a different car of roughly the same shape and color. My minimum fuel economy goal is 55 mpg while averaging posted speed limits. I generally top 60 mpg. See also my Honda manual transmission specs thread.


Last edited by California98Civic; 05-29-2020 at 08:45 AM..
|
|
|
|
|
The Following User Says Thank You to California98Civic For This Useful Post:
|
|
|
05-29-2020, 12:41 PM
|
#3 (permalink)
|
|
Master EcoModder
Join Date: Jan 2008
Location: Sanger,Texas,U.S.A.
Posts: 15,883
Thanks: 23,957
Thanked 7,219 Times in 4,646 Posts
|
no separation
Quote:
Originally Posted by JulianEdgar

I forgot I had this shot, taken where I was looking down a little on the tufted Jaguar.
Notice there's no separation on the upper surfaces at all from nose to tail, except for a tiny amount at the base of the rear windscreen.
Measured pressures:
Once you get a feel for it, it's one area in car aero where, if there's attached flow, you can be pretty confident where there will be low and high pressures - and also make a good guess at their relative values (on the upper surfaces, anyway).
Incidentally, look at how low the pressures are above and below the car, compared to the wake pressure. |
* On page 85 of your book you commented that, ' - implying this area was in a separation bubble.'
* The roofline is kinda 'fast.'
* Tufts around the C-Pillars implicate vorticity.
* Which are confirmed by the CFD image on page 86.
__________________
Photobucket album: http://s1271.photobucket.com/albums/jj622/aerohead2/
|
|
|
|
|
05-29-2020, 04:50 PM
|
#4 (permalink)
|
|
Banned
Join Date: Nov 2017
Location: Australia
Posts: 2,060
Thanks: 107
Thanked 1,605 Times in 1,136 Posts
|
Quote:
Originally Posted by aerohead
* On page 85 of your book you commented that, ' - implying this area was in a separation bubble.'
|
Which is why I said above that flow is attached "except for a tiny amount at the base of the rear windscreen". That's the separation bubble.
Quote:
Originally Posted by aerohead
* The roofline is kinda 'fast.'
* Tufts around the C-Pillars implicate vorticity.
* Which are confirmed by the CFD image on page 86.
|
Yes - what is your point? |
|
|
|
|
The Following User Says Thank You to JulianEdgar For This Useful Post:
|
|
|
05-29-2020, 05:13 PM
|
#5 (permalink)
|
|
Banned
Join Date: Nov 2017
Location: Australia
Posts: 2,060
Thanks: 107
Thanked 1,605 Times in 1,136 Posts
|
Quote:
Originally Posted by California98Civic
The tufts and the pressure readings visualize what is happening on the surface of the car. Add a third visualization. Wind tunnel smoke trails can help tell the story of what is happening in the area above the tufts.
Wind tunnel smoke trail pics are usually taken for promotion and they love to maneuver the wand to create bowing arches of gentle beauty. But the EM thread of wind tunnel and smoke trails has some shots that tell a messier story of the roof.
On this somewhat older Mercedes red dramatically highlights the vortices beginning to grow at the windshield header.
On this Caddy (more like your jag), the trail in the flow also begins to show vortices and breakup just behind the windshield header. It is less dramatic but you can see the growing disturbance of the smoke begin just behind the windshield header.
In this light, your pressure readings confirm the possibility that vortices are beginning to develop across your jag's roof just behind the windshield header. Your pressure readings show that pressure begins to return before reaching the point of greatest roof camber (from -105 to -95 ) and continues to climb after (‐50, -10, +30). That story of rising pressure in the flow is associated with the story of growing vorticity seen in the smoke trails.
And all the while the tufts would be pasted flat even across parts of the very messy rear window and trunk. Take for example my tufts from my Civic. They look smoother than expected after 45 mph 7 years ago when I took this shot. The vortices off the c pillars and the downwash from the roof are doubtlessly more turbulent than on the sides or the roof but the tufts can barely tell that story.
|
I think you have your logic reversed. Literally, the only thing that affects drag/thrust, lift/downforce are pressures acting on the surface of the car's body.
Nothing else.
And, as you can see from the example I have given, tuft behaviour and pressures correlate pretty well.
Smoke and tufts are just means of visualizing flow - and from that, estimating surface body pressures.
Without you giving examples that show both pressures and tuft or smoke behaviour, they unfortunately don't show much.
On Page 80 of my book I show smoke streamlines (Mercedes wind tunnel) and measured pressures (by me on the road) for two further cars. Again the correlation is much as you'd expect.
Quote:
Originally Posted by California98Civic
In this light, your pressure readings confirm the possibility that vortices are beginning to develop across your jag's roof just behind the windshield header. Your pressure readings show that pressure begins to return before reaching the point of greatest roof camber (from -105 to -95 ) and continues to climb after (‐50, -10, +30). That story of rising pressure in the flow is associated with the story of growing vorticity seen in the smoke trails.
|
The pressure on the Jaguar is lowest at the sharpest curve (windscreen header) and higher (ie less low!) as the curve flattens. The positive pressure at the tail is caused by the kick-up. None of that has to do with imaginary vortices on the roof. The pressures are as measured, and they reflect the wool tuft pattern of attached flow (and the little separation at the base of the rear windscreen).
The Mercedes pic looks suspiciously like a model. In full size, I am aware of no cars that have separation from the windscreen header - but that sort of premature separation is common in models where the Reynolds numbers are wrong.
Your Caddy pic just shows a thickening boundary layer - just what you'd expect. Nothing to do with vortices.
And I am sorry, but taking a pic of wool tufts with the car stopped is pointless. That tells you nothing!
|
|
|
|
|
05-29-2020, 08:48 PM
|
#6 (permalink)
|
|
Cyborg ECU
Join Date: Mar 2011
Location: Coastal Southern California
Posts: 6,299
Thanks: 2,373
Thanked 2,172 Times in 1,469 Posts
|
Quote:
Originally Posted by JulianEdgar
taking a pic of wool tufts with the car stopped is pointless. That tells you nothing!
|
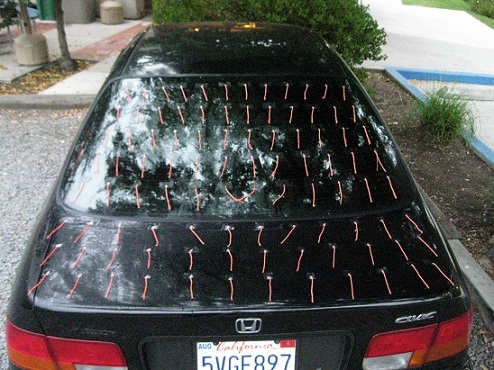
Not so! It was wicked cool. I had placed the tufts and as I did my tests that week one day my commute took me into light, misty fog as I rolled along at 45 mph, the tufts got wet and stuck in place. When I arrived, no longer in the mist though still shielded from the sun by the overcast sky, the body was mostly air dry but the tufts were still wet and "pasted" in place at their 45 mph position. Made a great picture. You can see evidence of the downwash from the roof, the c-pillar vortices, the recirculation bubble around the third tail light, and the reattached flow at the trailing edge of the decklid. The counter rotating trailing vortices from the c-pillars show up: clockwise on the left makes the tufts angle left slightly and counterclockwise on the right makes the tufts angle rightward a little.
__________________
See my car's mod & maintenance thread and my electric bicycle's thread for ongoing projects. I will rebuild Black and Green over decades as parts die, until it becomes a different car of roughly the same shape and color. My minimum fuel economy goal is 55 mpg while averaging posted speed limits. I generally top 60 mpg. See also my Honda manual transmission specs thread.
|
|
|
|
|
The Following User Says Thank You to California98Civic For This Useful Post:
|
|
|
05-31-2020, 04:01 AM
|
#7 (permalink)
|
|
Banned
Join Date: Nov 2017
Location: Australia
Posts: 2,060
Thanks: 107
Thanked 1,605 Times in 1,136 Posts
|
Quote:
Originally Posted by California98Civic
You can see evidence of the downwash from the roof
|
I just see attached flow from the roof onto the rear window.
Quote:
Originally Posted by California98Civic
the c-pillar vortices
|
I can see no evidence of these in the tuft pattern.
Quote:
Originally Posted by California98Civic
the recirculation bubble around the third tail light
|
I'd just call it a very small separation bubble - hard to guess the pattern of flow within the bubble.
Quote:
Originally Posted by California98Civic
and the reattached flow at the trailing edge of the decklid.
|
I'd just say that the car shows excellent attached flow, except for a tiny separation bubble at the centre, base of the rear glass.
Quote:
Originally Posted by California98Civic
The counter rotating trailing vortices from the c-pillars show up: clockwise on the left makes the tufts angle left slightly and counterclockwise on the right makes the tufts angle rightward a little.
|
Maybe - but that normally shows on the pillars not the trunk (boot) lid - and there doesn't seem to be such flow on the pillars. I'd suggest instead that the flow speed on the sides of the car is faster than on the trunk lid, and the airflow is moving towards this low pressure. Surface panel pressure measurement would prove/disprove this in about 15 min.
I'd love to see some action pics - but if they look like this, I'd say there's very little you can do to improve things in the pictured areas. Honda did a great job.
Edit: compare with the Honda Legend I used to own:

Last edited by JulianEdgar; 05-31-2020 at 05:23 AM..
|
|
|
|
|
05-31-2020, 10:11 AM
|
#8 (permalink)
|
|
Cyborg ECU
Join Date: Mar 2011
Location: Coastal Southern California
Posts: 6,299
Thanks: 2,373
Thanked 2,172 Times in 1,469 Posts
|
Well we are definitely comparing our readings of the tea leaves here, so... You point out that "Honda did a good job," and I'd agree. The tufts surprised me and then discussing it here, looking closely again at the rear window angle, and reading in Hucho demonstrated that my coupe has an approximation of the 22° or 23° angle Hucho's description suggest is often highly effective for the notchbacks. That and a ton of other optimization.
I think that your Legend shows a similar pattern. Look at how the top tufts, toward the sides on the glass are angled inward. This would be the meeting of the flow from the top and the sides meeting. It would be where those large rotating vortices begin.
Lemme gamble f on a guess for a second: you had the Sedan?
__________________
See my car's mod & maintenance thread and my electric bicycle's thread for ongoing projects. I will rebuild Black and Green over decades as parts die, until it becomes a different car of roughly the same shape and color. My minimum fuel economy goal is 55 mpg while averaging posted speed limits. I generally top 60 mpg. See also my Honda manual transmission specs thread.
|
|
|
|
|