the following two examples demonstrate the generic trends, but are not necessarily accurate for any particular vehicle.

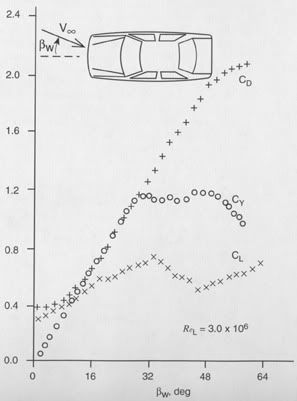
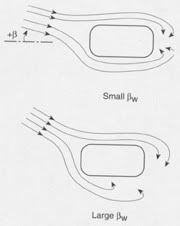
For the first example, let us examine a generic sports sedan. Its top view is shown in Fig. 6.14 (this data is for a 20% scale model, at Re L = 3.0 x 10 6 , with smooth underbody). The graph depicts the effect of wind side-slip angle ▀ W on the aerodynamic coefficients. In order to explain the source of these aerodynamic loads let us observe the generic flow field depicted in Fig. 6.15. Basically, for the small, near-zero side-slip conditions the flow is attached on the vehicleĺs sides, and the pressure distribution (from a top view) resembles the pressure distribution on a thick airfoil.

The pressure distribution data of Fig. 6.16 (after SAE paper 73-0232) reinforces this comparison. This analogy to the airfoil case explains the almost linear increase of side force, C Y , with side-slip angle ▀ W , which eventually stalls at about ▀ W ~ 25░ (see also Fig. 5.16).
Returning to Fig. 6.15, you can see that at the larger side-slip angles the flow separates at the side of the vehicle, and when combined with the separation at the back, creates a much larger separation bubble. Because of the low pressure inside this separated zone, and the increase of the frontal area with increasing ▀ W , the drag coefficient increases sharply, as shown in Fig. 6.14. Usually, the larger separation bubble created by the side slip increases the velocity above the vehicle, resulting in a smaller increase in the lift. At very large side-slip angles (of over 35░), the separated area behind the rear window is reduced by the momentum of the side flow, causing a reversal of this trend in the lift (e.g., a local reduction in the lift).
Race Car Aerodynamics - Designing for Speed *-* Bentley Publishers - Repair Manuals and Automotive Books
Relevant even at lower speeds...