 06-23-2010, 12:47 AM
|
#50 (permalink)
|
|
Master EcoModder
Join Date: Jul 2009
Location: New York
Posts: 513
Thanks: 2
Thanked 101 Times in 74 Posts
|
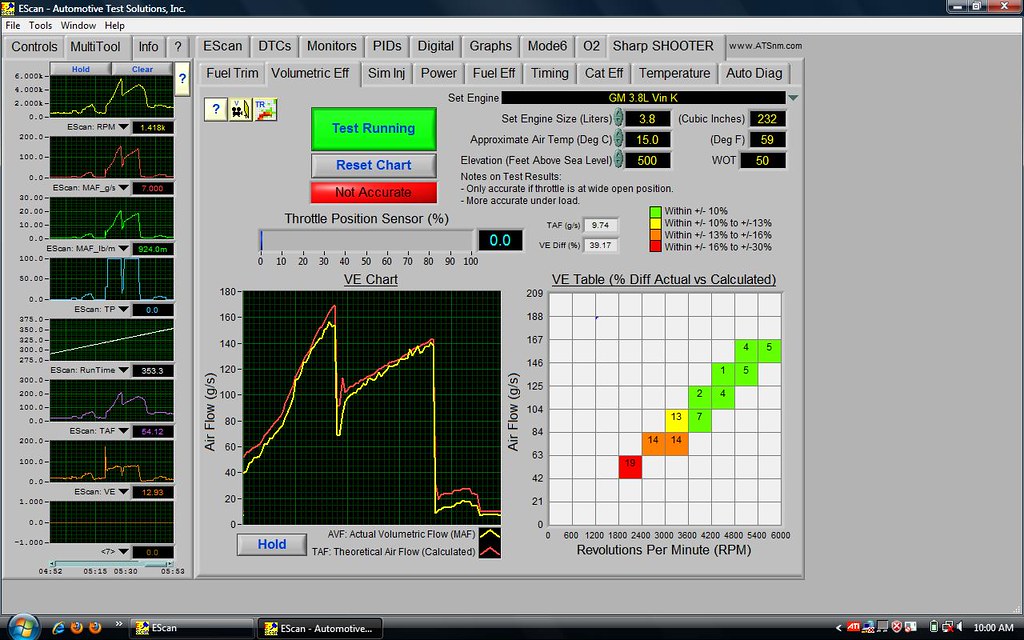
VE volumetric efficiency , Graphed "good"

the "client" 's 2006 Honda civic VE graph would not have looked like this
at some point , the intake restriction would have limited air flow and the
calculated and actual graphs would have diverged paths .
when that happened
and Measured Air flow was unable to increase , there would have been no increase in calculated load or fuel delivery , but , the same effect could be implemented with the drivers right foot .
the system would have remained at the fuel trim desired by the ECM , the car just would not have gone any faster . not a desirable modification -
and
there would have been no extra acceleration / power at WOT available for passing or getting out of a sticky situation
VE calculators like this are only really accurate at WOT , up to WOT they provide a comparison that should not be assumed to be 100% accurate .
WOT passes in 2nd gear over 4 k rpm up hill should produce close to 100% calculated load if the MAF is reporting correctly and there are no restriction to flow .
on this graph for this car , VE at WOT is only about 85%
which kinda sux
, see the little graph 2nd from the bottom on the left .
that indicates a restriction to flow , ie clogged cat or air filter or
choice C , something else
how about some examples of the "free" graphing software
showing this very condition ? on your alleged "client" 's car .
Last edited by mwebb; 06-23-2010 at 01:06 AM..
Reason: missed the graph 2nd from the bottom on left
|
|
|
|