Why do in MatLab what you can do in Excel? (answer: It's easier and more accurate in MatLab, but also harder).
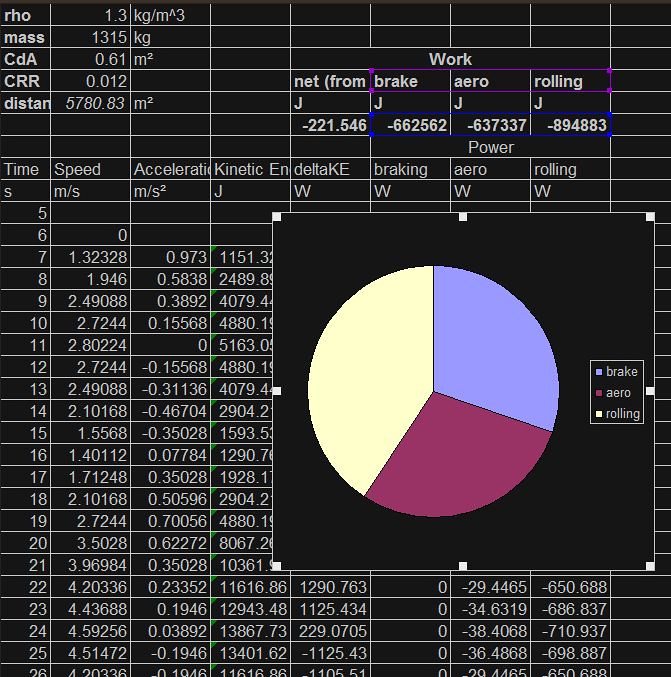
I've made the naive assumption that if you're losing more than 0.5m/sē, you're braking, otherwise you're doing useful work. This pie chart shows the breakdown (pun!) of braking, rolling, and aero resistance. I've assumed your starting and ending elevation are the same.

So, Saand, it looks like you are dividing your fuel roughly equally between idling, braking, aero, and rolling resistance.
But what about the question in the thread title? For your particular commute, check out the following table:

Get you some better tires and a stick, Saand.
However, this driving profile is MUCH slower than the kind of driving I do, and if you're like me, I suspect you'd be best served by putting a higher priority on aeromods. Naturally, if you brake more than Saand, you'll want to see if you can do some weight reduction.
Does anyone else have speed versus time data representing different driving styles? Perhaps even one with the stereotypical wife behind the wheel, giving both pedals more of a workout than you do?
I've attached the spreadsheet. It assumes a timestep of one second between your data points, but it's otherwise pretty friendly and self-explanatory.