Quote:
Originally Posted by NeilBlanchard

I'm going to ignore your strawman arguments, and your personal insults.
|
So let me get this straight...
You somehow think that solar irradiance (defined as the amount of solar output that is delivered at a unit area per unit time) is some sort of a strawman argument? Especially when the solar irradiance data shown can easily be seen to be correlated to the rise in average temperature and the rise in average atmospheric carbon dioxide concentration?
Are you now going to claim that increased solar output causing higher temperatures on Earth, is just a strawman argument?
It's not an insult if it happens to be correct, Neil. You are now directly ignoring direct scientific data showing a valid and credible cause of rising temperatures, from a reputable source, and are continuing to blame Mankind for global warming. Not an insult, just an observation.
Quote:
Originally Posted by NeilBlanchard

The insulating effect of our atmosphere is what slows down the heat loss back out into space. The Moon lack any significant atmosphere, so it gets very cold.
|
And very HOT, Neil. You forgot that.
Quote:
Originally Posted by NeilBlanchard

It is the carbon dioxide in our atmosphere which is most responsible for insulating the Earth, and slowing down the heat loss to a point where the temperature is livable. By changing the level of carbon dioxide rapidly by a significant amount greater than at any time during human existence or indeed higher than at any time in the past 650,000 years -- can only mean that temperatures will increase to be hotter than at any time during that period of time.
|
WRONG!!!
It is water vapor that is most responsible for the greenhouse effect. Even real pro-AGW scientists agree with that.
Quote:
Originally Posted by NeilBlanchard

We can look back at even earlier history to see what happened, and when, in relation to the carbon dioxide levels. At the point about 65 million years ago, when the island that became what we call India finished moving out of the southern hemisphere, and ran into the southern part of Asia -- the level of volcanic activity diminished, and the rate of weathering increased.
Carbon dioxide was at about 1,000PPM at the point -- and there was no permanent ice anywhere on Earth, and it was essentially tropical everywhere on Earth -- with alligators etc., living in the place we now call Alaska. Then the level of carbon dioxide began to drop, as the weathering process occurred. When carbon dioxide level reach about 450PPM, then Antarctica started to freeze up. Later, when the levels dropped lower, the Arctic froze up.
So, we know about what level these critical things happen. Those thresholds are what all the concern is about. Again, these things happen because of chemistry and physics, and they will occur whether or not all humans agree with it or not.
When the people who know the most about the climate get very concerned, then we should all be very concerned, too.
|
You are again confusing cause and effect, Neil. Just like I knew you would.
Quote:
Originally Posted by NeilBlanchard

Do you think you can second guess Stephen Hawking on his area of expertise? How about a vulcanologist? Or, an oceanographer? Or, a geologist? Would you argue with Craig Venter about DNA? |
Why do you continue to persist with these pleas to authority, Neil? By your own logic, you should not question the thousands of climatologists who are skeptical of AGW.
Quote:
Originally Posted by t vago

Quote:
Originally Posted by NeilBlanchard

Here's the 160 years corresponding to the time we humans have been burning carbon fuels:

Carbon dioxide was ~270PPM at the beginning of this period, it reached ~300PPM in 1904, and it is ~389PPM now. Case closed. |
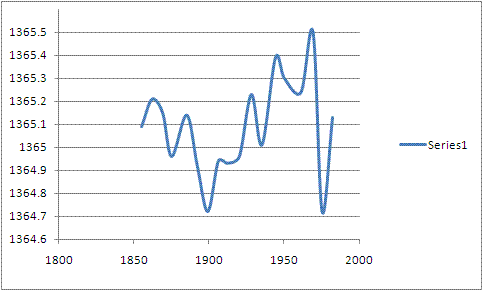
Solar irradiation estimates from NOAA. First set here. (Are you going to claim that NOAA is now tainted?)

Total solar irradiance from 1855 AD to 1982 AD.
Diid Maankind caause the Suun to increase its ouutput duuring the tiime we weere buurning foossil fuuels, Neeil?
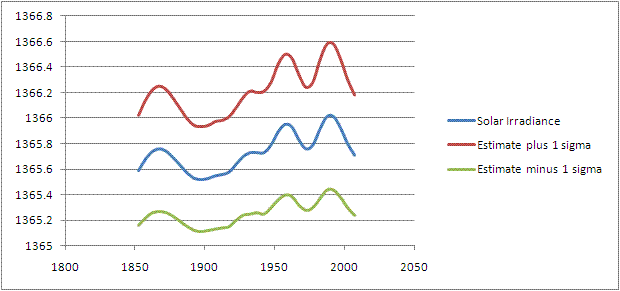
Second set here. (Well, Neil? Are you?)

Total solar irradiance from 1852 AD to 2007 AD.
Those curves above and below the main curve represent one standard deviation from the main curve.
Gee, Neil, looks like the Sun increased its output during the same time period as your precious graphs depicting the rise of carbon dioxide. Gee, Neil, looks like the two sets of graphs tend to track each other pretty well. Gee, Neil, looks like the Sun warmed up at about the same time carbon dioxide increased.
Gee, Neil, looks like AGW isn't proven. |
You know, I think I'll just cut-n-paste this to every one of my responses to you about Eaaaaaaaaaaaaaaaaaarth, Neil. Strawman argument, indeed.