I have been playing with some numbers & charts,
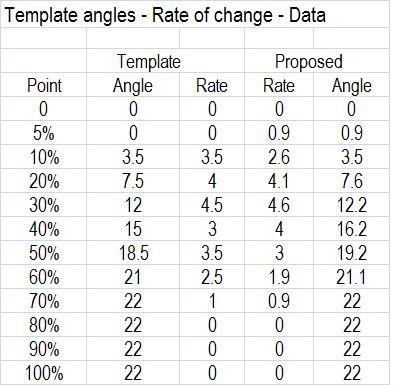
trying to determine a template equation, I thought I'd look at the angles listed and the rate of change as this will express the derivative of the curve, as the angles are obviously approximations for real world application they aren't going to be perfect.
When I charted the rate of change, seems to me the angles could do with some adjustment, primarily at the 30-60% range as this seems to be where the rate of change peaks, but there is a number of peaks where I think there should only be one.
If the rate is changing, then there will be undulations in the surface which are not good for the airflow, I know the angles are just a guide and the final result needs to be finished by hand & eye, but getting a bit closer to the ideal at the start may make it easier to emulate the template profile.
I did another series with proposed adjustments, here is the data & chart, open for critique, is this the right approach?