Quote:
Originally Posted by freebeard

The rabbit hole goes a long way down. Can anyone explain the scaling on the Re axis to me?
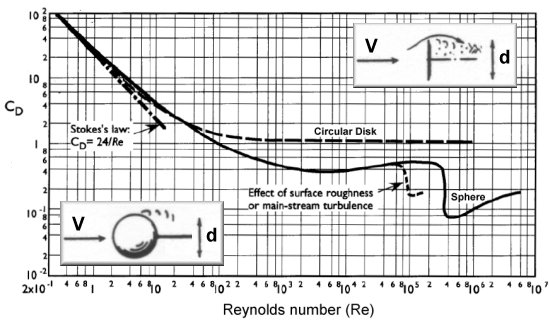 |
It's a logarithmic (Log) scale. Each major division increases by a power of 10. Where the 1 is would be Re = 1; where the 10 is would be Re = 10; the next one is 10 squared (see the 2 to the right just above it?), or 100; the next is 10 to the third power (cubed) or 1000; next is 10 to the fourth, 10,000; next is 10 to the fifth, 100,000; then 10 to the sixth, 1,000,000; and last is 10 to the seventh, or 10,000,000.
The other numbers in between the big divisions show how far that vertical line is to the next big division. Take that number and multiply it by the nearest big division before it to get the Re for that line. For instance, the vertical line to the left of the word Sphere is close to the line marked 4 at the bottom, but that line is to the right of the 10 to the fifth major line. 10 to the fifth is 100,000, so we multiply 100,000 by 4 to get 400,000 for the Re when the drag of the sphere drops way down.
Log scales are used to squish the graph down to a reasonable size.