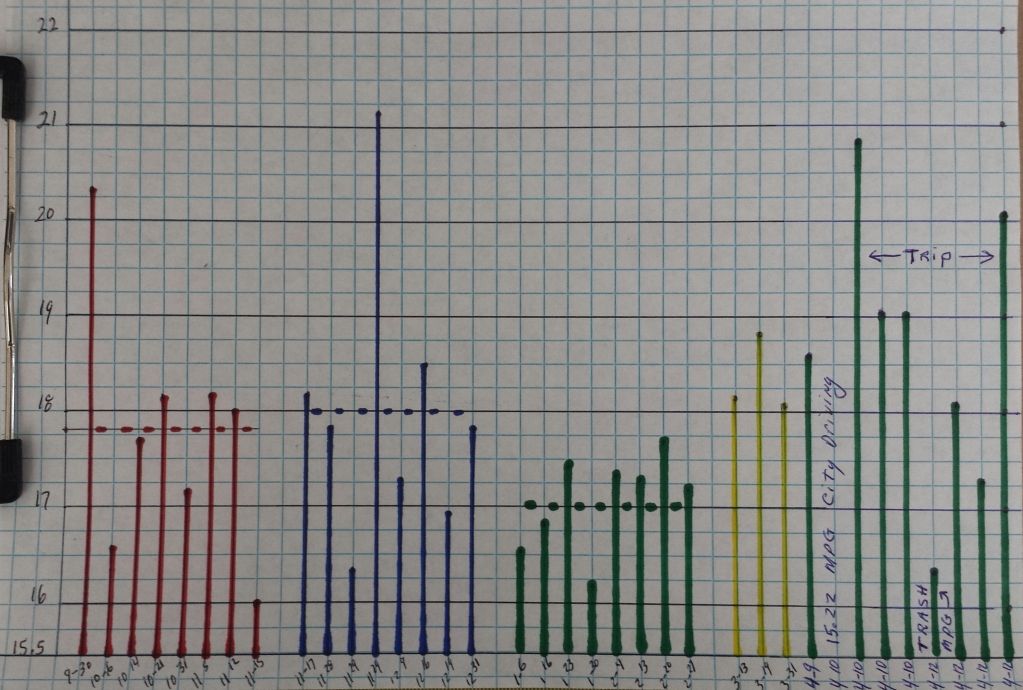
I am not a hyper miler but I do try to drive in such a way that I can improve my MPG outcomes. This includes normal acceleration, coasting to slow down before braking, using gravity to my advantage, allowing speed to drop off on hills, and using cruise control where practical.
With the warmer spring weather we have been getting higher mileage. The best way to show this I felt was to graph my composite averages. After careful checking I am finding my composite MPG readouts are about 2% higher than my actual gallons pumped. I have determined this by averaging the averages back to mid November or my last 17 fill ups with the aerolid on the truck.
The graph above may be a bit obtuse, but essentially it shows dates at the bottom, and MPG's ranging from 15 mpg at the bottom and 24 mpg's at the top. The red graph on the left is for the brief month I owned the F-150 after the break in period but I was running without aero mods. The green line represent composite averages from mid November after I returned from Little Rock with the Aerolid.
The peak in the first graph represents a pure road trip to Deming and back where I returned a high 23 mpgs. The climb near the end of the graph represents the return of warm weather and lower air densities.
The shift from red to green represents 11/15 and 11/17 dates of my average with aero on my return from Little Rock with the aero package. The red line represents my averages without sero appliances.
I am traveling to Deming on Saturday March 21st and I plan on attaching the boat tail for this 120 plus mile round trip. The return will be at night in lower temperatures however. On April 10th I am traveling to Monahans, TX to meet Phil Knox at the state park there, and I am retuning on April 12th. We should be able generate some very good data over the 800 mile round trip journey including plenty of 80 mph data.
I am planning on a blog about my results on EV World after this trip. I also will post some results here. One last comment here. Looking st the green graph you can see how cold weather from December through mid February has killed my MPG performance. You can also see it is improving rapidly from then on, into March.