Quote:
Originally Posted by Vman455

..........
Yes! In fact, the pressure is below atmospheric from just above the emblem, all the way up the hood, and then across the upper part of the windshield.
I used a digital manometer and pitot tube ($50 on Amazon), 40 feet of clear vinyl tubing, one of my new Scanivalve pressure patches (less than $10), and some painter's tape to gather this data.
|
I cannot comment on your testing methods, but you have put a lot of work into this. Bravo!
A post of yours from 2018......
https://ecomodder.com/forum/showthre...e-11745-5.html
Quote:
Originally Posted by Vman455
........... Take a look at a CFD pressure distribution map of the 2012 Prius:
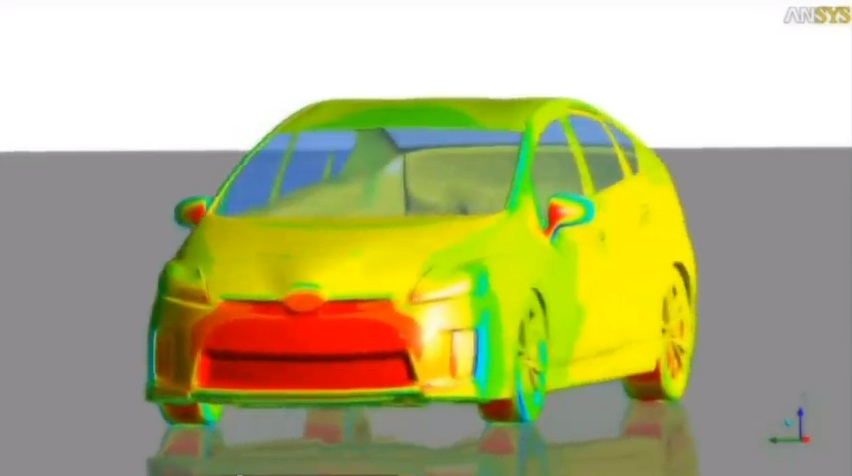
That line of green at the scallop edge is lower pressure than the yellow across the rest of the hood, and the pressure at the cowl behind it isn't any higher than across the hood. It looks stupid, but it's apparently effective enough to use on multiple models. |
The 2018 post has no link or citation credit from where it was sourced. However I'm going to assume it is of standard color coding.
If somebody can post a typical CFD color key I'd appreciate it.
I just want to compare the two data sets.