I keep mentioning vectors here, but people without any physics won't know what I am talking about. But it's really easy - and quite empowering.
A vector, in the way I am using it, describes a force. A force (a push or pull) has a strength and a direction. If we use an arrow, the arrow points in the direction the force is acting, and the length of the arrow shows the strength of the force.
So if we take my Insight, and look at pressures acting over the rear hatch, we can see that the pressures here are all negative - they're pulling, and largely upwards.
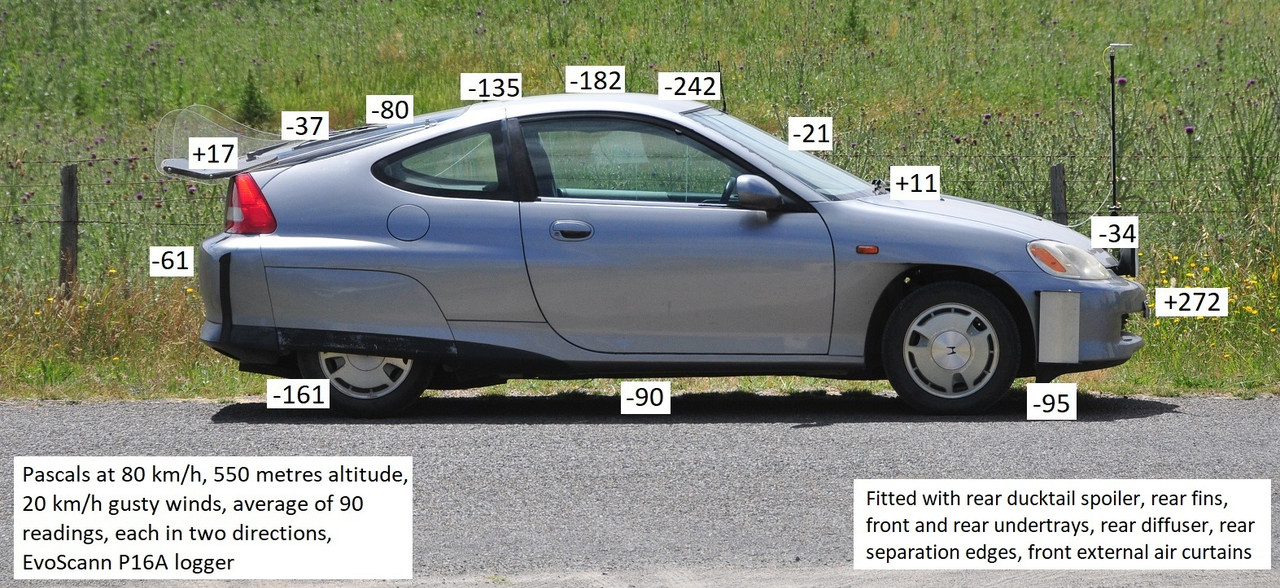
So let's look at one of those 'pulling pressures' on the hatch - say -80 (ie minus 80 - less than atmospheric).
Now, all pressures act at right-angles to the panel, so let's draw in the panel angle:

...and then the vector (the force direction and magnitude) at right-angles to the panel:

Now it gets really exciting. How much lift and drag is this force causing? We can find that out by using the 'triangle of forces':

Here the green line shows the magnitude and direction of
lift resulting from the -80 pressure, and the blue line shows the direction and magnitude of the
drag resulting from the -80. (I could have added arrow heads to these - upwards for the lift force and backwards for the drag force).
You can use math geometry to work out the actual ratios of the forces, or just draw it to scale (as I did on a bit of paper). That shows the ratio of lift:drag for any low pressure on the Honda's hatch is about 100:15, or each 100 units of lift has 15 units of drag.*
So if I increase pressures on the hatch, as I have done with my rear spoiler, that same ratio applies for
reducing lift and drag.
Now to work out the actual forces involved, we need to multiply the pressures by the areas, and then do our triangle of forces for each. So it's certainly not an easy way of working out total drag changes, but it very clearly shows where the drag (and thrust too of course - look at the -34 at the nose) forces are occuring.
*That's actually very conservative - as shown in the diagram above, it's a bit higher (ie steeper 'best fit' angle line).