My Edgarwit air curtains give a measured reduction in drag (using the throttle stop method) and tuft testing shows slightly better flow attachment on the side panels behind the front wheels.
My measured pressures without, and then with, the air curtains were as follows:


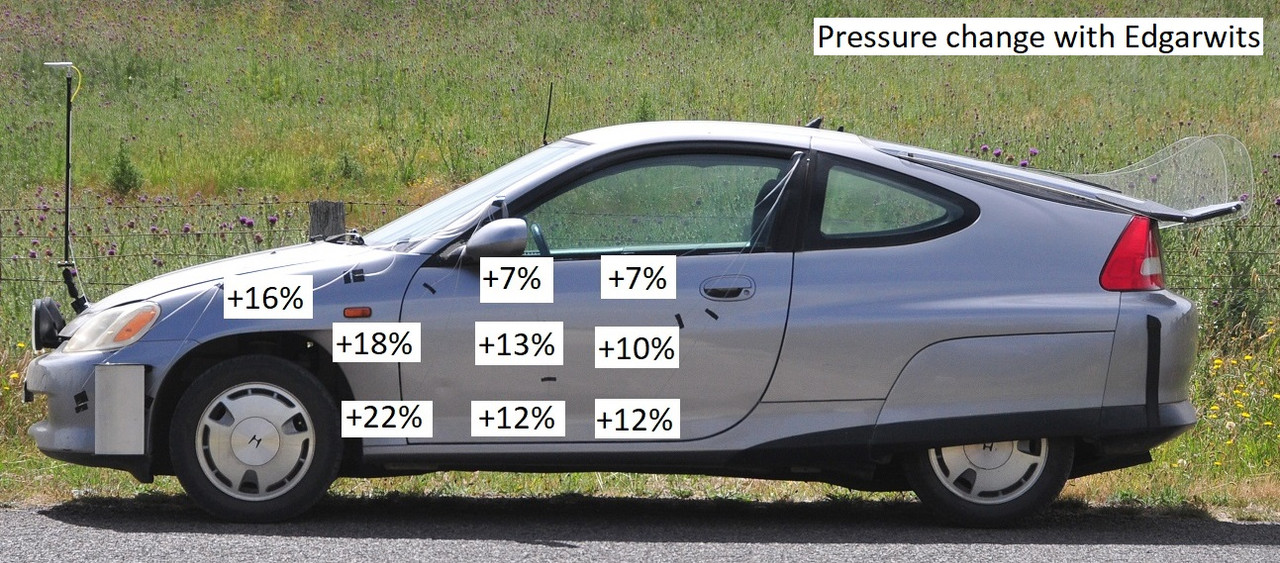
...giving this percentage
increase in pressures:
But does an increase in pressure actually indicate better flow attachment? After all, more air and faster speed (eg under the car) causes a
lower pressure.
I went to all my references to find out about side pressures but this data is almost impossible to find. I do have diagrams for a 1970s Mercedes sedan (and the lines of equal pressure diagram shows lots of variation on the side of the car) but the numbers are too small to read! Lots of CFD images of car pressures just show the side of the car all the same colour - either there's not enough resolution or they're not right, based on the Mercedes data and my measurements.
So, if there is improved flow attachment, do side surface pressures rise or fall?
I decided to do a test on our Mercedes. Rather than set up all the measuring pucks and the EvoScann logger, I used a single puck, static pressure ref provided by a pitot tube, and Magnehelic gauge. That is, total cost of measuring gear under US$100.
Previously with the EvoScann I measured -91Pa in the centre, lower part of the rear door. Today with the Magnehelic, I measured -73Pa (gusty wind, hotter day).
Now, what would happen if I deliberately caused separation in front of this point on the car? I attached a device in front of the area, a device which I was sure would cause separation.

The measured pressure
decreased to -103Pa.
So I am fairly confident in saying that when you are setting up air curtains, and possible even wheel faces, the higher the pressures you can measure on the side of the car, the better. That makes trialling different cardboard (etc) designs much more straightforward.