Quote:
Originally Posted by AEOLUS

What about this, how would you read this 2 graphs?
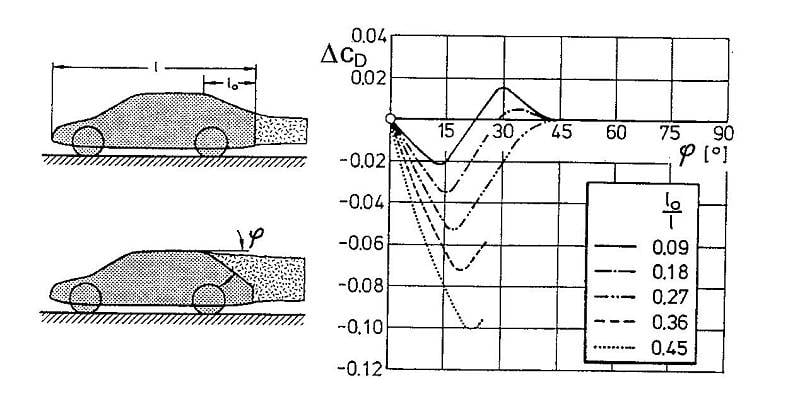
Why Cd has negativ and positive numbers at first graph?
 |
These are for simplistic, primitive, prismatic test models, of which no current productions share any similarity.
On the upper table, for 0.09%, and 0.18% aft-body lengths, you're witnessing an initial drag reduction, then introduction of increasing vortex drag, until vortex-burst occurs, and wake takes on a squareback wake.
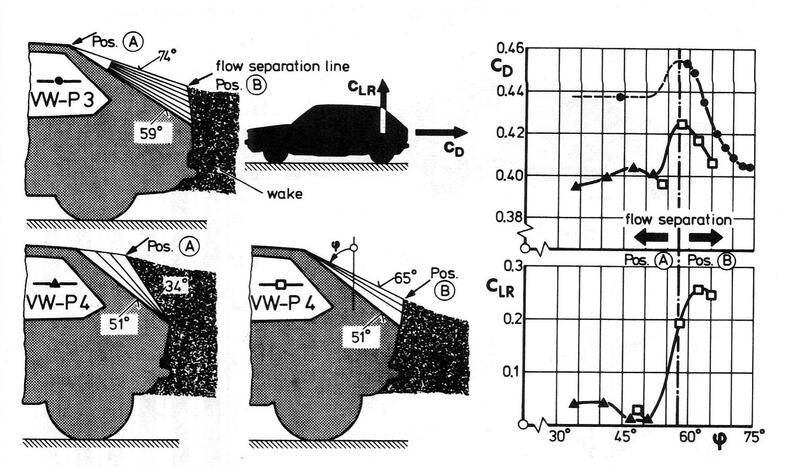
The lower tables show all the test permutations of Giugiaro's (sp?) original Golf of 1975. Again, drag drops, then vortex drag builds until 'burst.'
Lesson: a 'large' high-pressure wake is preferred to a 'small' low-pressure wake.
Vortex-drag is BAD!!!!!!!!!!!!!!!!! Really bad!