View Single Post
Old 12-29-2008, 10:10 PM   #18 (permalink)
NeilBlanchard
Master EcoModder
 
NeilBlanchard's Avatar
 
Join Date: May 2008
Location: Maynard, MA Eaarth
Posts: 7,907

Mica Blue - '05 Scion xA RS 2.0
Team Toyota
90 day: 42.48 mpg (US)

Forest - '15 Nissan Leaf S
Team Nissan
90 day: 156.46 mpg (US)

Number 7 - '15 VW e-Golf SEL
TEAM VW AUDI Group
90 day: 155.81 mpg (US)
Thanks: 3,475
Thanked 2,950 Times in 1,844 Posts
Hi,

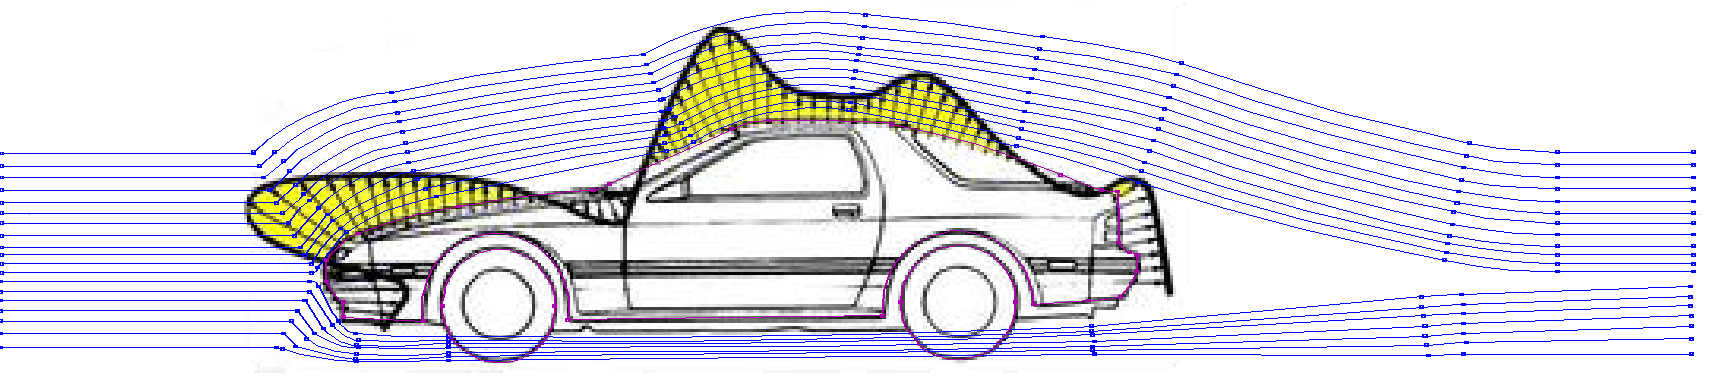
I've attempted to show the air flow lines, overlaid on the "velocity" image (if that is what it is showing):


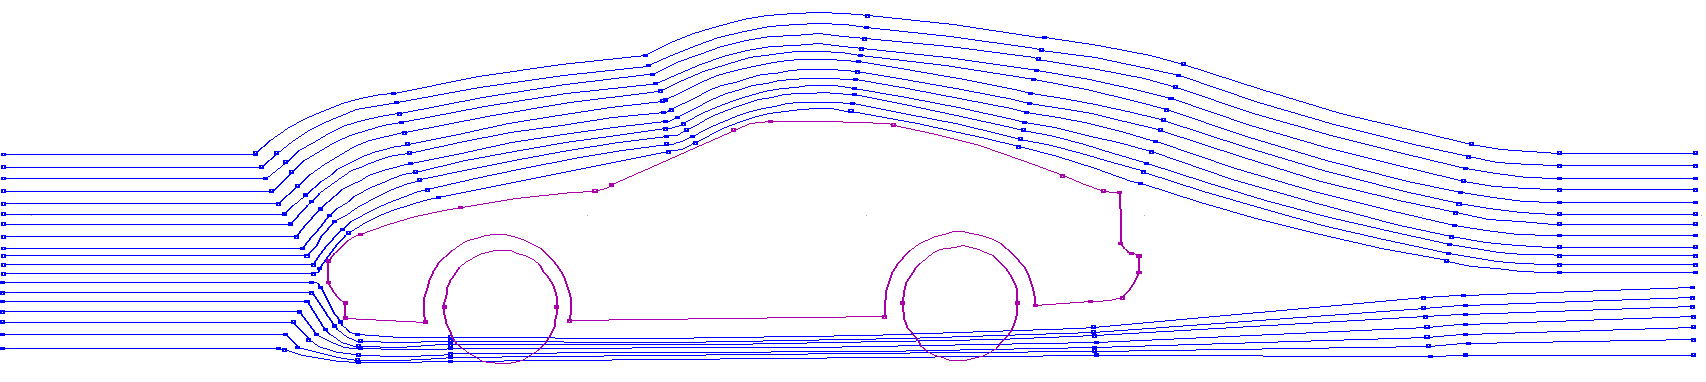
And here it is with just the flow lines:


As you can see the greatest velocity occurs where the air is being pushed aside at the greatest angle, and this is what gives it the greatest velocity. I think that the nose pushes the air up above the main part of the hood, and then the upper part of the windshield again pushes it up; creating another higher velocity zone.
__________________
Sincerely, Neil

http://neilblanchard.blogspot.com/
  Reply With Quote