Update:
I did a second set of steady state testing today.
Notes on testing:
Tested in this order B, A, B2, A2
warmed up car by driving 14 miles before testing (I think this was not enough)
Testing conditions:
Winds 5-8 N, NE
Temp, 78-84
RH: over 90%
speed was 55MPH using cruse
road was about as flat as I have around here.
A= normal no skirt
B= with both wheel skirts on
1S= run 1 South
1N= run 1 North
each way was 1 miles of testing
measurements with scan gauge
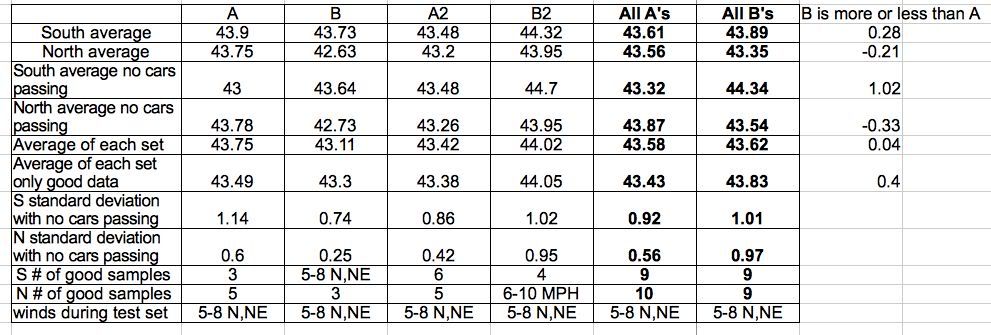
Here is the data:


Comments:
Wind was far more consistent today. it had some change to it but not a lot and it did about the same thing during each set of runs. I tossed of runs where there was lots of wind or no wind and still had more samples than yesterday.
The test mile was almost level, it had a hump at the start and end (intersection high spots). This made for less acceleration by the cruse control.
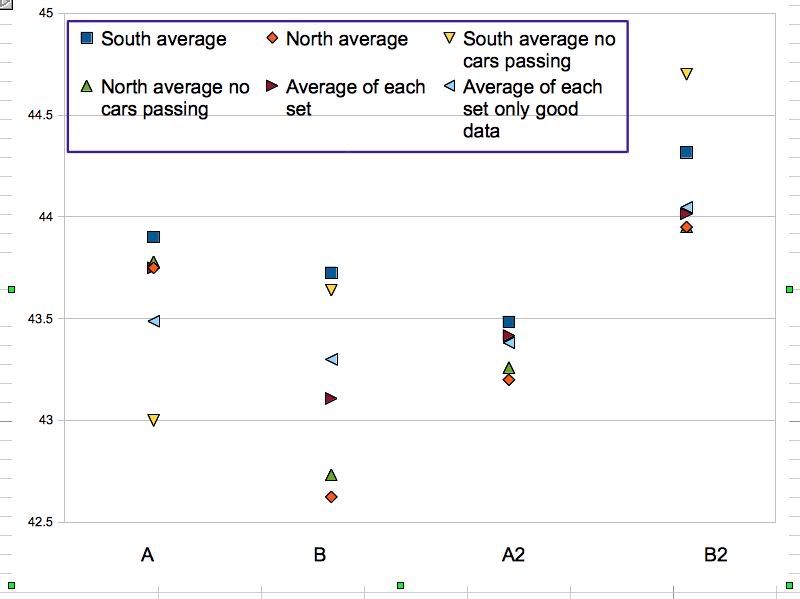
I might make up a graph without set B. I ran this set first and I think that the car was not fully warmed up by the 14 mile drive I did to warm it up. By the end of set B things seem to have fully warmed up as the next sets are similar to each other.
Summery: the data shows a slight benefit with the wheel covers on (.4 MPG or about 1%), This is still within the error rate for the test (standard deviation of between .6MPG & 1.1 MPG).
The benefit is even better if I toss out set B and only use the B2 data (.62 or 1.5%) with the same SD.
Those of you who have done testing like this, what do you think? valid results or not?
Attached is the data file with both today's and yesterdays tests.