Seen that chart before, but makes more sense now, might go back and spit out some numbers for the TC ratio of 2.55, see how that looks.
But for now here is some more on NACA 040, I re did the chart to shift the 0 point to the peak and resize y axis to 1, along with the 10% gridlines along the x axis, this layout may be more familiar to people here.
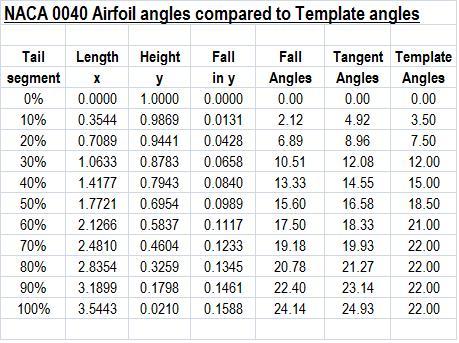
I also calculated out a table to show the fall in height (or width) at each 10% segment, as the height is scaled to 1, it is easy to just multiply your starting height by the factor in the table to give you expected height at that point.
The fall represents the fall over the previous 10% of the curve and I have calculated out the fall angles, I also tabled the tangent angles at each 10% and then compared those to the template angles at the same point, not too far away, a close relative at the very least.