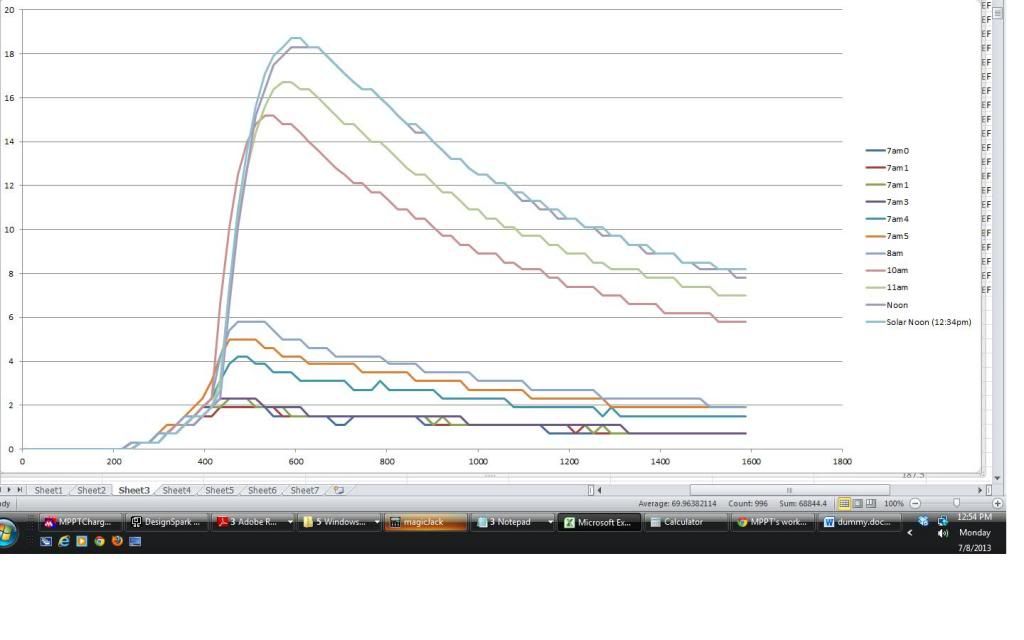
Here's a pretty cool graph that I made today by having the PWM duty cycle vary from 0 to 100% at different times throughout the day. The span across the whole duty cycle took 40 seconds each time. The input open circuit voltage was around 200v, and the output voltage was about 49v (48v battery bank that's mostly dead). The lowest curve was when the sun just started peeking over the panels. The highest curve was at solar noon (12:34pm) down here just south of Phoenix in Maricopa. Notice that to the right of the peak power point, there are occasional spots where it's a fake maximum power! Oh that makes me mad. This sort of illustrates the problem with algorithms that blindly search for any local maximum power point. It was 5 280w multicrystaline panels in series. I've got 3 more strings of 5 panels that I'll add to see how the curves change, but I think I need more batteries first. That's a lot of amps at 48v:
