View Single Post
Old 07-24-2013, 09:20 AM   #6 (permalink)
mikeyjd
Master EcoModder
 
mikeyjd's Avatar
 
Join Date: Mar 2013
Location: Grand Rapids, MI
Posts: 838

Matchbox - '93 Ford Festiva L
Team Ford
Last 3: 70.16 mpg (US)

Salamander - '99 Chrysler Concorde LXI
Team Dodge
90 day: 30.3 mpg (US)

Urquhart - '97 Toyota Tacoma 4x4 V6 3.4L DLX
Pickups
90 day: 25.81 mpg (US)

Smudge - '98 Toyota Tacoma
90 day: 40.65 mpg (US)

Calebro - '15 Renault Trafic 1.25 dci
90 day: 39.39 mpg (US)
Thanks: 1,380
Thanked 209 Times in 155 Posts
Quote:
Originally Posted by Diesel_Dave View Post
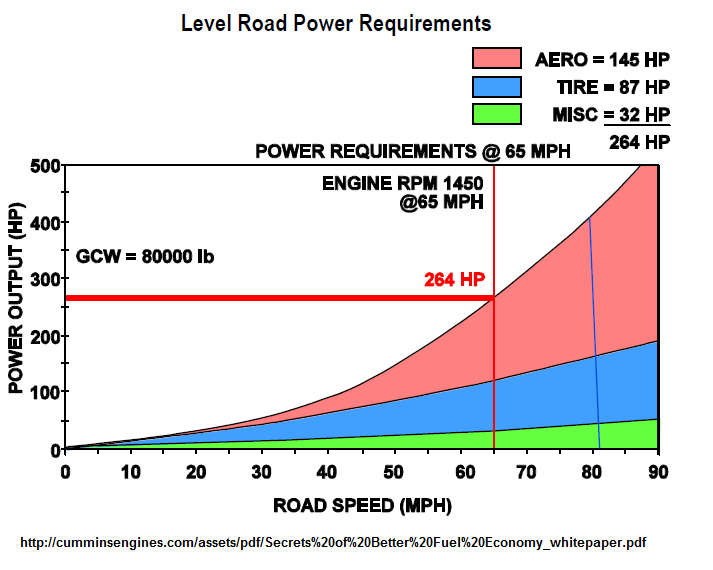
Not sure if this is what you're looking for, but I posted this a while ago. It's from Cummins and for a semi truck, but you get the idea as the same principles apply.
This is similar to what I was looking for. The one I was thinking of was posted by Darin I think, and it displayed mph on a grid with aero % increasing incrementally. Something like 20mph = 30% and 40mph = 50% . It was a nice looking graph and I just wanted to have it on hand for reference.
  Reply With Quote