07-21-2013, 08:40 PM
|
#1 (permalink)
|
|
Master EcoModder
Join Date: Mar 2013
Location: Grand Rapids, MI
Posts: 838
Thanks: 1,380
Thanked 209 Times in 155 Posts
|
Looking for drag effect vs mph chart
I know I've seen one or more, but I've come up empty so far in my searches. I'm looking for a chart that shows % of aerodynamic drag effect at increasing speed. Thanks.
|
|
|

|
 Today Today
|
|
|
|
 Other popular topics in this forum...
|
|
|
|
|
07-21-2013, 10:07 PM
|
#2 (permalink)
|
|
Master EcoModder
Join Date: Feb 2011
Location: Phillips, WI
Posts: 1,018
Thanks: 192
Thanked 467 Times in 287 Posts
|
Right here on this site: Aerodynamic & rolling resistance, power & MPG calculator - EcoModder.com. Results are in a chart, every 5 MPH from 5 MPH to 200 MPH. If you want a graph, just cut and paste into a spreadsheet.
__________________
06 Canyon: The vacuum gauge plus wheel covers helped increase summer 2015 mileage to 38.5 MPG, while summer 2016 mileage was 38.6 MPG without the wheel covers. Drove 33,021 miles 2016-2018 at 35.00 MPG.
22 Maverick: Summer 2022 burned 62.74 gallons in 3145.1 miles for 50.1 MPG. Winter 2023-2024 - 2416.7 miles, 58.66 gallons for 41 MPG.
|
|
|
|
|
The Following 2 Users Say Thank You to JRMichler For This Useful Post:
|
|
|
07-22-2013, 06:06 PM
|
#3 (permalink)
|
|
Master EcoModder
Join Date: Jan 2008
Location: Sanger,Texas,U.S.A.
Posts: 16,404
Thanks: 24,471
Thanked 7,410 Times in 4,800 Posts
|
chart
Quote:
Originally Posted by mikeyjd

I know I've seen one or more, but I've come up empty so far in my searches. I'm looking for a chart that shows % of aerodynamic drag effect at increasing speed. Thanks.
|
Hucho presents a Drag vs Top Speed table in his book.
It's for a particular range for frontal area and inertial class,but he makes a generalized relationship.
The most important criteria for us modders is that the unmodified vehicles top speed actually reflect full net power,just above the rated power rpm.
American cars are 'governed' with their gearing and won't actually achieve their actual power-limited/drag-limited top end.
European cars appear to be geared to actually take advantage of all available horsepower.
Once you're properly geared and have a bona-fide terminal velocity at rated power + 100-200 rpm,then any 30% drag reduction will net a 10% increase in top speed under standard conditions.
This ratio reflects standard passenger car radial tire technology performance
circa 1986.
__________________
Photobucket album: http://s1271.photobucket.com/albums/jj622/aerohead2/
|
|
|
|
|
The Following 2 Users Say Thank You to aerohead For This Useful Post:
|
|
|
07-22-2013, 08:00 PM
|
#4 (permalink)
|
|
Master EcoModder
Join Date: May 2011
Location: Indiana
Posts: 1,194
Thanks: 112
Thanked 511 Times in 213 Posts
|
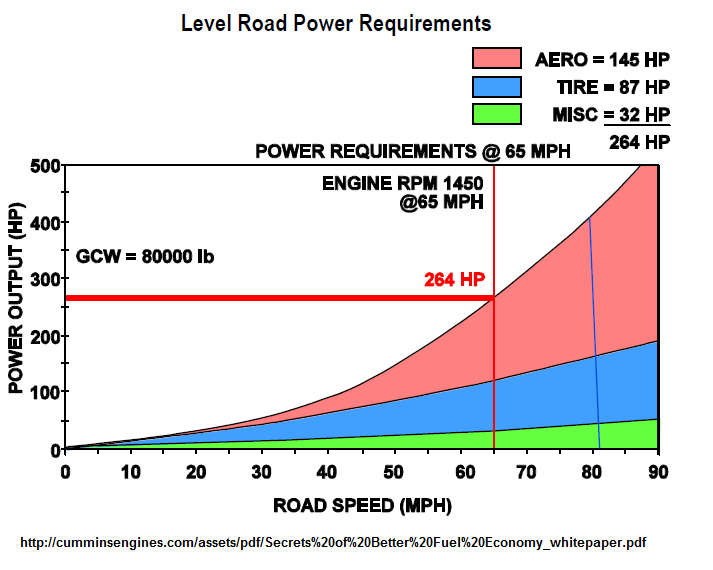
Not sure if this is what you're looking for, but I posted this a while ago. It's from Cummins and for a semi truck, but you get the idea as the same principles apply.
__________________
Diesel Dave
My version of energy storage is called "momentum".
My version of regenerative braking is called "bump starting".
1 Year Avg (Every Mile Traveled) = 47.8 mpg
BEST TANK: 2,009.6 mi on 35 gal (57.42 mpg): http://ecomodder.com/forum/showthrea...5-a-26259.html

|
|
|
|
|
The Following 2 Users Say Thank You to Diesel_Dave For This Useful Post:
|
|
|
07-22-2013, 08:14 PM
|
#5 (permalink)
|
|
...beats walking...
Join Date: Jul 2009
Location: .
Posts: 6,190
Thanks: 179
Thanked 1,525 Times in 1,126 Posts
|
...industry "rule-of-thumb" is that HP(aero) = HP(road) at 55 mph...roughly.
...where (road) is tires & engine, etc.
|
|
|
|
|
07-24-2013, 10:20 AM
|
#6 (permalink)
|
|
Master EcoModder
Join Date: Mar 2013
Location: Grand Rapids, MI
Posts: 838
Thanks: 1,380
Thanked 209 Times in 155 Posts
|
Quote:
Originally Posted by Diesel_Dave
Not sure if this is what you're looking for, but I posted this a while ago. It's from Cummins and for a semi truck, but you get the idea as the same principles apply.
|
This is similar to what I was looking for. The one I was thinking of was posted by Darin I think, and it displayed mph on a grid with aero % increasing incrementally. Something like 20mph = 30% and 40mph = 50% . It was a nice looking graph and I just wanted to have it on hand for reference.
|
|
|
|
|
07-24-2013, 10:38 AM
|
#7 (permalink)
|
|
Master EcoModder
Join Date: May 2011
Location: Indiana
Posts: 1,194
Thanks: 112
Thanked 511 Times in 213 Posts
|
Incidently the chart also highlights the stupidity of the diesel pickup "power wars" where pickup owners think they need 400+ hp. A 80,000 lb semi truck only needs 264 hp to cruise down a level highway at 65 mph.
__________________
Diesel Dave
My version of energy storage is called "momentum".
My version of regenerative braking is called "bump starting".
1 Year Avg (Every Mile Traveled) = 47.8 mpg
BEST TANK: 2,009.6 mi on 35 gal (57.42 mpg): http://ecomodder.com/forum/showthrea...5-a-26259.html
|
|
|
|
|
07-24-2013, 12:21 PM
|
#8 (permalink)
|
|
Aero Deshi
Join Date: Jan 2010
Location: Vero Beach, FL
Posts: 1,065
Thanks: 430
Thanked 669 Times in 358 Posts
|
Quote:
Originally Posted by Diesel_Dave
Incidently the chart also highlights the stupidity of the diesel pickup "power wars" where pickup owners think they need 400+ hp. A 80,000 lb semi truck only needs 264 hp to cruise down a level highway at 65 mph.
|
One thing to keep in mind here though is the 400+ HP is used for a very short time, 250+ hp output from most regular pick-up or car engines for any appreciable length of time would result in a melt down, speeding ticket, destroyed property, and/or death.  |
|
|
|
|
07-24-2013, 06:22 PM
|
#9 (permalink)
|
|
Master EcoModder
Join Date: Jan 2008
Location: Sanger,Texas,U.S.A.
Posts: 16,404
Thanks: 24,471
Thanked 7,410 Times in 4,800 Posts
|
incrementally
Quote:
Originally Posted by mikeyjd
This is similar to what I was looking for. The one I was thinking of was posted by Darin I think, and it displayed mph on a grid with aero % increasing incrementally. Something like 20mph = 30% and 40mph = 50% . It was a nice looking graph and I just wanted to have it on hand for reference.
|
*The drag FORCE varies as the square of the velocity:If you double your velocity,you're hitting twice as much air,twice as hard.
The Power required to overcome the drag force varies as the cube of the velocity:When you double your velocity,you're hitting twice as much air,twice as hard,twice as often.
--------------------------------------------------------------------------
When you know the 'starting point' for your car you can throw in a new drag coefficient,holding everything else constant and see how it impacts the road load horsepower for any given velocity.
--------------------------------------------------------------------------
Top speed is achieved when power-train losses,rolling resistance,and aero drag equal the brake horsepower of the engine at whatever conditions you're operating at.
-------------------------------------------------------------------------
The mechanical efficiency of the power-train is essentially constant at full power so you can just discount the brake horsepower by that fractional multiplier,then any drag reduction allows a speed increase which balances the new aero load and new(higher) R-R value at the higher velocity at that discounted horsepower.
__________________
Photobucket album: http://s1271.photobucket.com/albums/jj622/aerohead2/
|
|
|
|
|
The Following User Says Thank You to aerohead For This Useful Post:
|
|
|