Hey all,
Been away for a few years, but recently got inspired to dig out the old spreadsheets and have another play with the equations and after a lot of fiddling I finally managed to get the specs down pat.
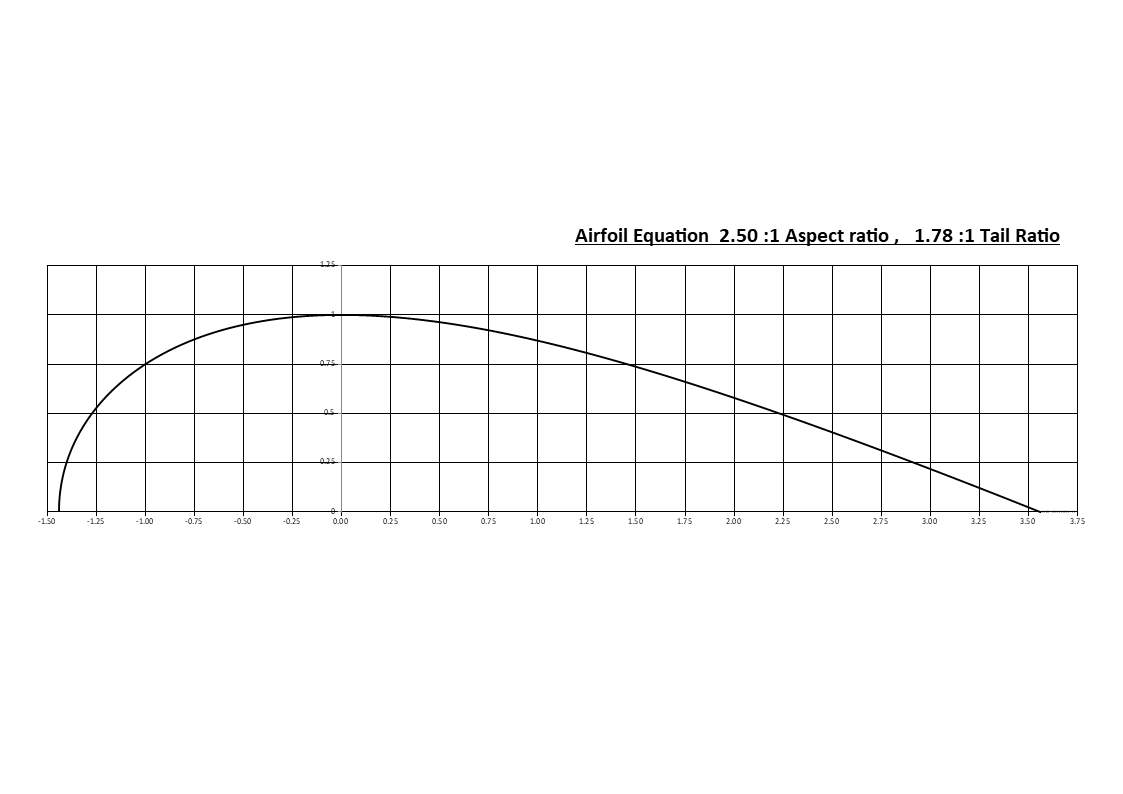
2.5:1 Aspect ratio
1.78:Tail ratio
And also managed to get the kink out of the tail, I have left the x & y grid visible and they are in the same graduations so one can easily measure the grid lines on screen (zoom for more detail) to ensure x:y proportional integrity, i.e. the squares should be true squares.
Here is the calculated curve:
The next stage was to overlay the Template AS-II, which is just slightly more aggressive than the specified ratios, both the 2.5 and the 1.78 which the equation is limited to, overlay below:
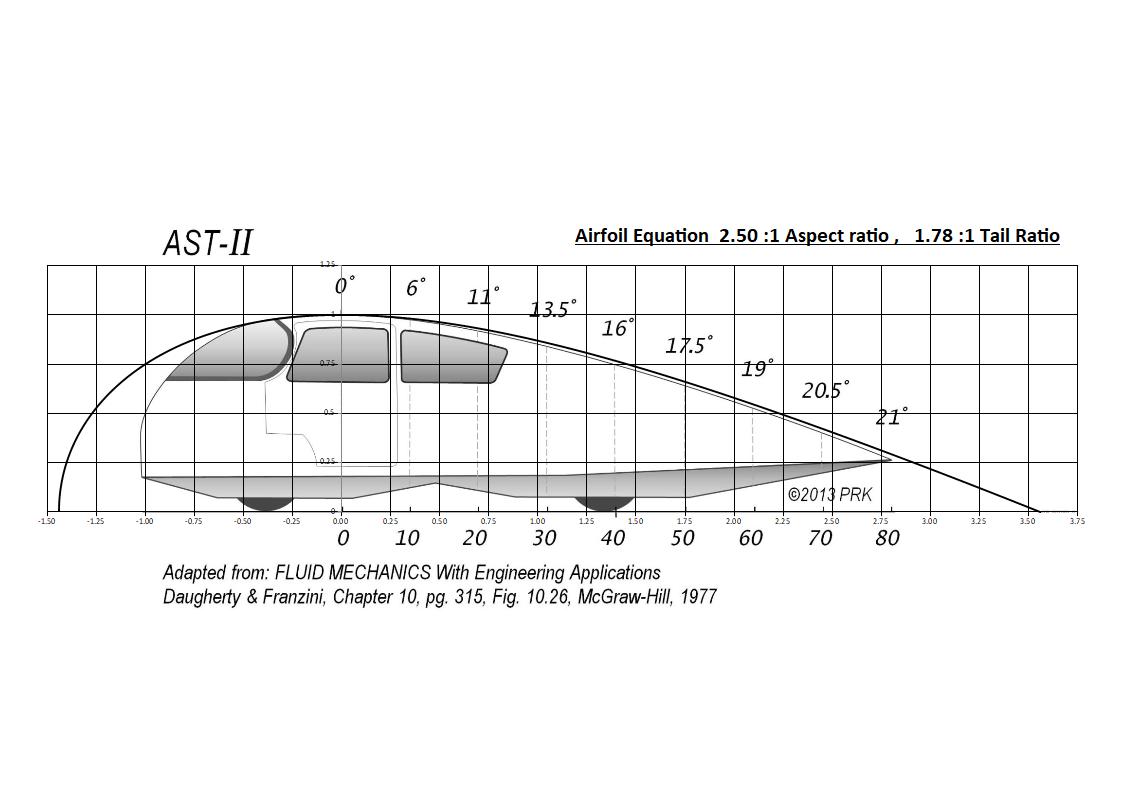
I tried as best I could to match up the key positions, firstly I was careful to only adjust template size by corners which maintains length:width integrity, then under high zoom lined up ground line of template with y=0 line on equation chart and then adjusted max height to y=1 on chart, then centered the template apex line 0% position with x = 0 line on chart, the top and bottom dash appear slightly displaced, so I went with the dashed line between the two which lined up best with the x=0 position.
I did do some overlays with stretching the two images and they lined up almost perfectly whether you stretched the template or compressed the chart, so at this stage it looks pretty good.
***Edit note - When I copied the high res ASII image it looked different under the curve, so zoom in and measure on screen and found the original ASII image was compressed, at 1.737:1 tail ratio and the High res one was stretched slightly at 1.787, so I compressed it a bit and did another one.
Corrected overlay below looks a bit better:
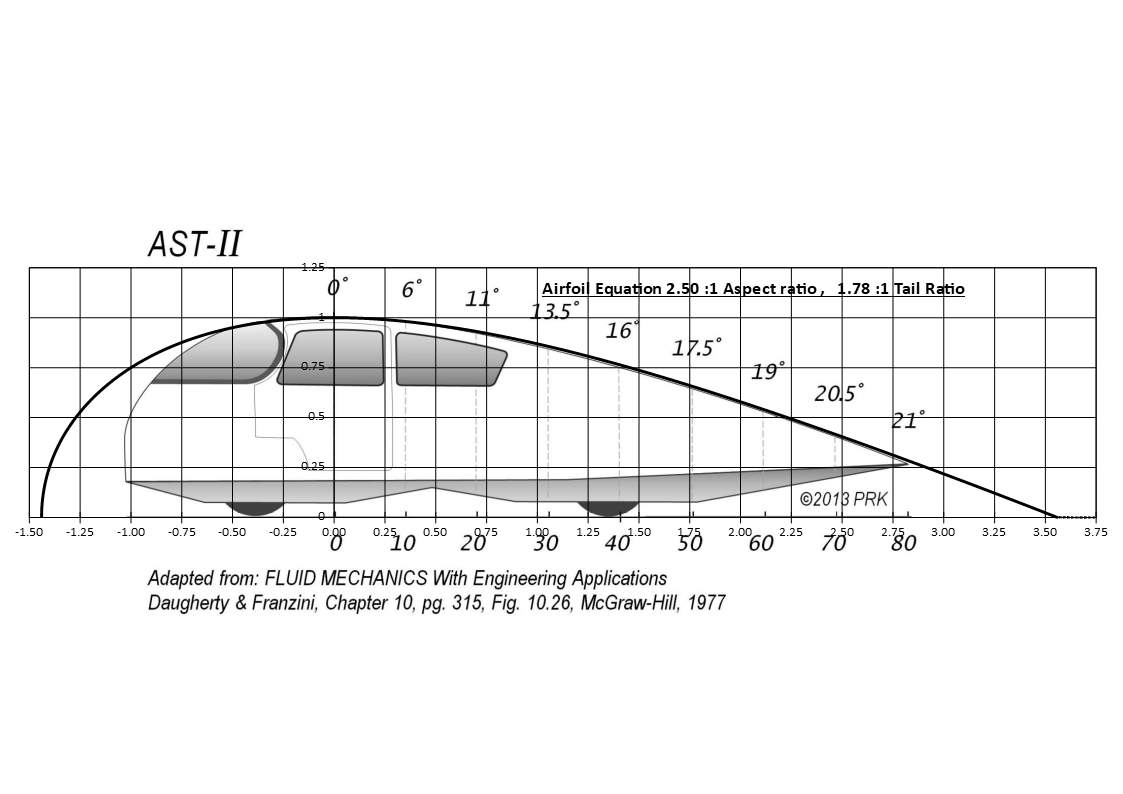
End of edit ***
The Data tables and Equation details are included below:

With the data table I've decided to go 5% increments so 20 data points, but to image the actual curve I used over 5,000 data points in the spread sheet, the table is just related to the tail portion, as this is what the majority is interested in. Column 2 & 3 are the data co-ordinates so where x=0 y=1 and at end where x=3.560 y=0, I set y-max at 1 so the data can easily be multiplied out by whatever your starting height is for the tail, eg if your starting height is 60 inches or 1.5 meters then multiply both x & y points by the either 60 or 1.5 and the result is in the units of your specific case.
The 4th and 5th columns just show the incremental fall and cumulative fall in the elevation points in the tail
The 6th and 7th columns are the angles of the equation tangent angles and the template tangent angles for a direct comparison, I have included the additional 10 points for the template in 5% increments, will explain later how I estimated those points.
The 8th and 9th columns compare the rate of change in the angles between the equation and template, the equation CoEfficients I used previously gave a kick back at the end of the tail, basically around the 80% mark the rate of change began to accelerate again, with this version I have pushed the change of rate to around y=0 or below, basically just beyond the end of the tail. The template points show that kick back rates at the end, but thats primarily because of the extra points I've inserted, the decision was a compromise by using a series of averaging factors to get the smoothest rate of change over time curve, what I've presented is the best option in my opinion.
For those really keen the equation is listed below the table, it basically gives you the y result for any x position, below that on the right hand side is the coefficient values I used, CoE 2,3,&4 went down to 9 decimal places as I was trying to get the equation balanced within the specified parameters, so in a number of places I have gone to 10 - 12 decimal places.
The other two details below the CoE values are the "tangent angle calculation factor", to calculate the tangent angle I used basic trigonometry, so calculating the angle of inclination between a point above and below the required tangent point, though this is not the true tangent at 10 decimal places the difference for this purpose is irrelevant. The other factor is "Added template segments factor", that's the added 5% incremental segments in between the specified template 10% increments, as mentioned I used the figure of 0.54, so just slightly weighted above average, just note this is only represented in the table template angle column and is not reflected anywhere in the inclinations of the images.
If you've gotten this far, you must be keen, the last left hand column is the airfoil and chart specs, the first 4 lines are the basic specs of the "body of revolution" and hence are self explanatory. The 5th line is the specified height, as said I chose 1 so that it makes up-scaling easy, the 6th line is a feedback line, it tells you this equation achieves a result of 1 with an accuracy to 10 decimal places.
The 7th & 8th line, simple 1.4400+3.5600=5.000, the 9th line 3.5600/2.000=1.7800, the 10th line 1.4400/5.0000=28.8% and finally the 11th&12th lines just specify the parameters of the chart so the curve fits within the frame.
That's me for now, over and out.