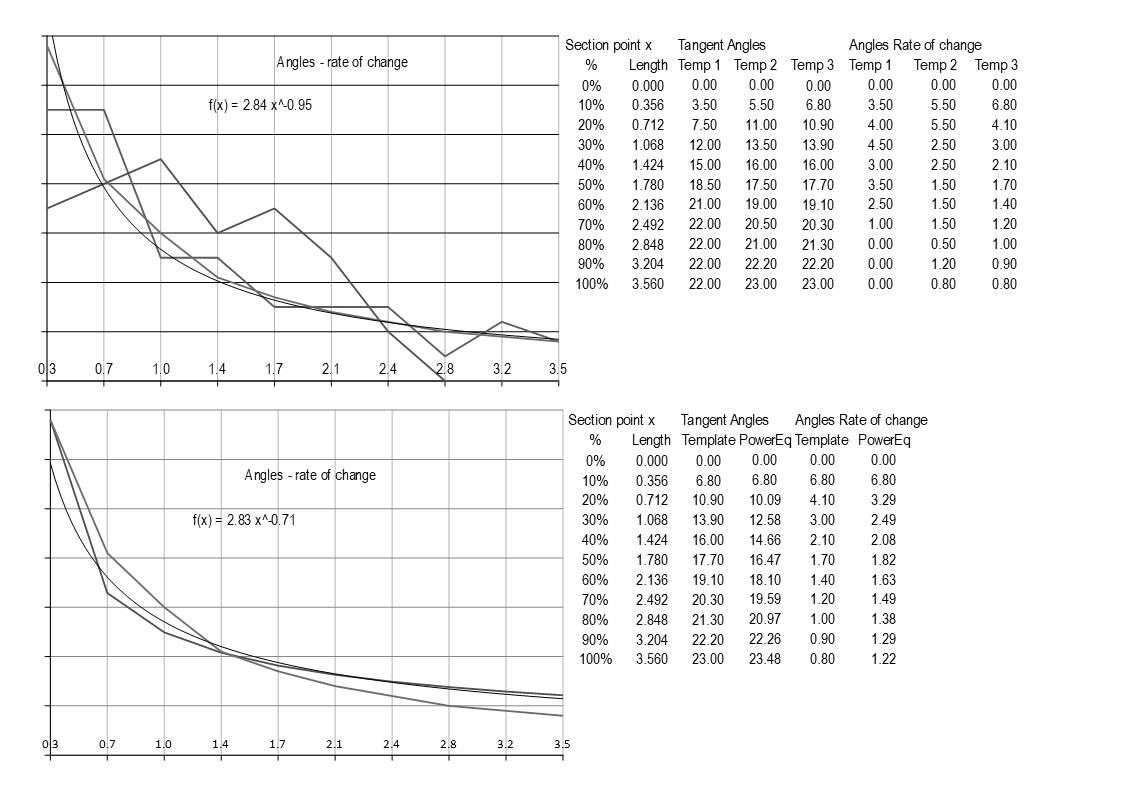
When I was reviewing some of the equations I've posted I noticed some anomalies with the Angles Rate of change from segment to segment, this would be the acceleration of inclination. Even though the curve itself may look ok, when you chart the rate of change it shows an irregular pattern, just like a hill may appear to have a smooth contour from a distance but is full of ups & downs when you walk it. This is a bit of an acid test, but I figure we may as well try to start closer to perfection knowing that the errors will only multiply in the build stage. Just as an example I charted some of the original template angles, I did original charts in colour, but forgot and saved pics in B&W, so a bit harder to trace lines, but I'm sure you'll get the idea:

The wildest line on the first chart is the original template angles, the next zagging one was the re-measurements off the AS-II template and the most consistent is the current template angles, the 6.8 to 23 degrees. I included a trend line for the current template plot which is the fine curved line in there and the equation on the chart is for the trend line. So going to the next stage I started playing with the template angles so basically trying to keep the start at 6.8 and end at 23 whilst getting the centre to conform to a continuous curve and the second chart shows that progression, although to attain a fall of 1 in 3.56 the depature angle was 23.48 degrees at the 100% mark. I used straight line charting as the smooth line can be deceptive when there are very few plot points.
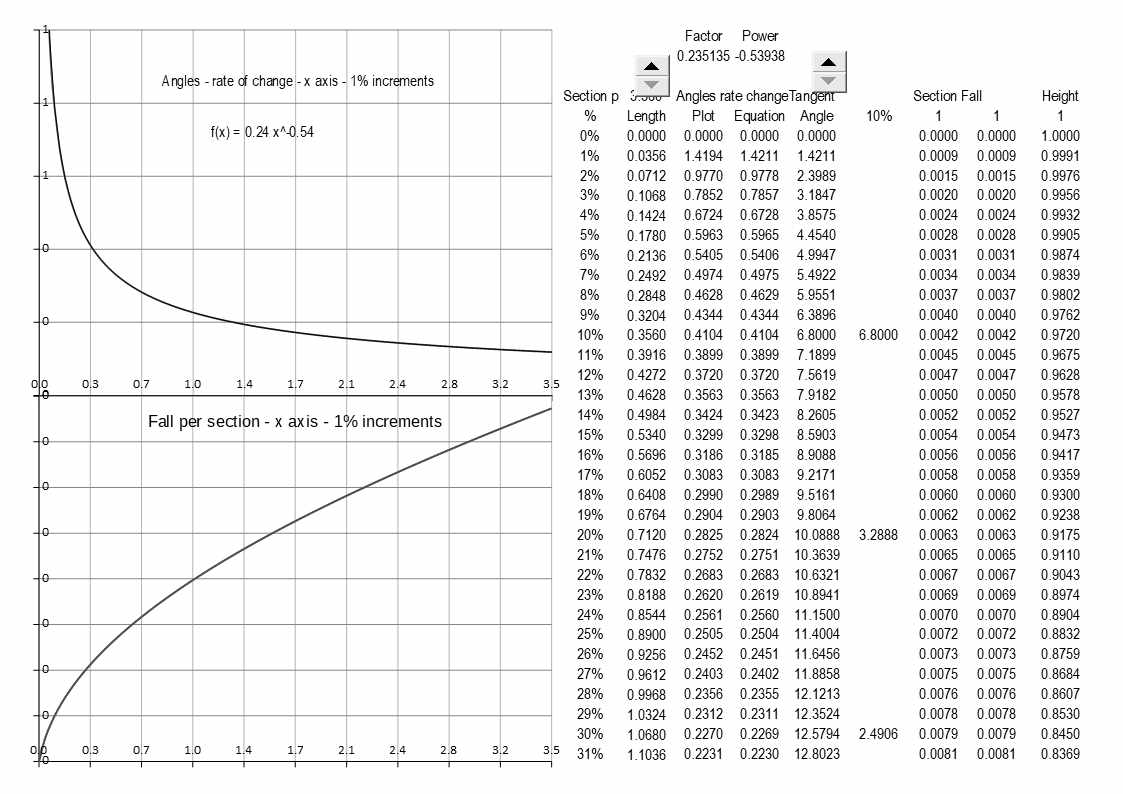
Then to fine tune, I made a table in 1% increments and charted those points:

The first chart is the progressive angle change and the lower chart is the actual fall per section calculated from those angles, and there is a snapshot of the first part of the table, as there are only two variables and just multiplication the curve can only be continuous unlike polynomial equations. There is a limited range of options whilst trying to work within "what we believe the constraints to be", for example is 6.8 degrees the max at the 10% mark or could one go higher?
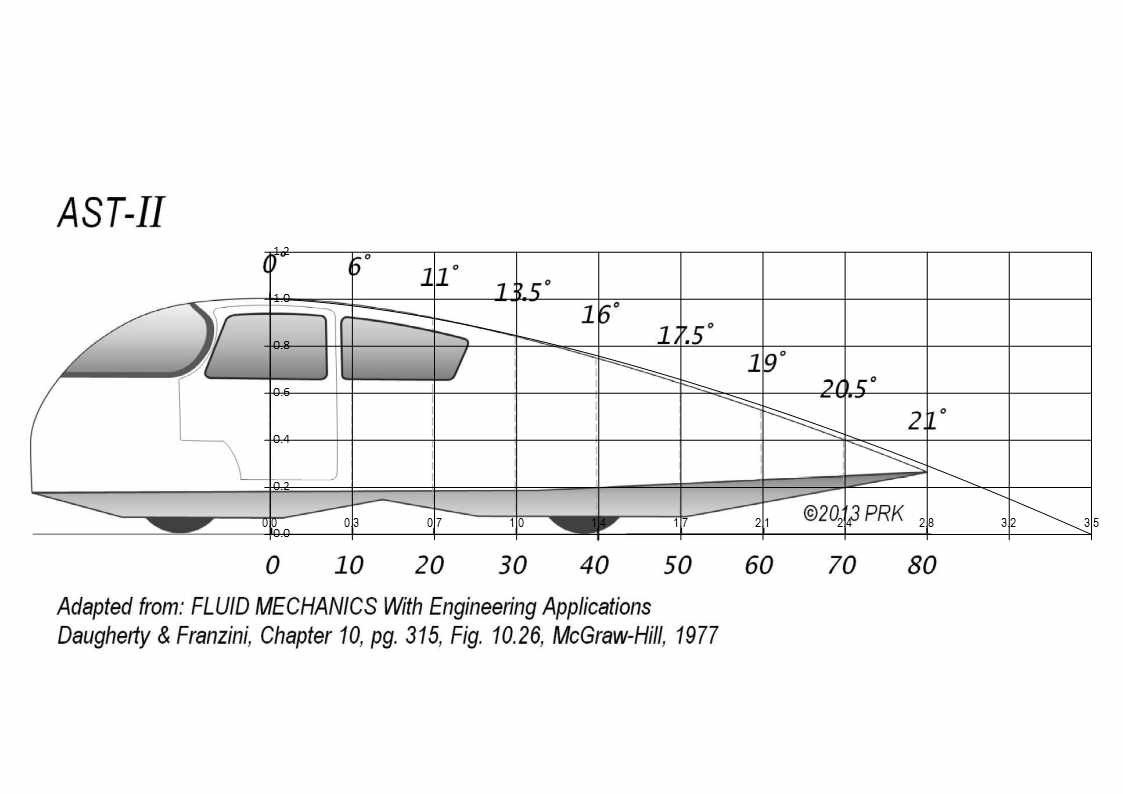
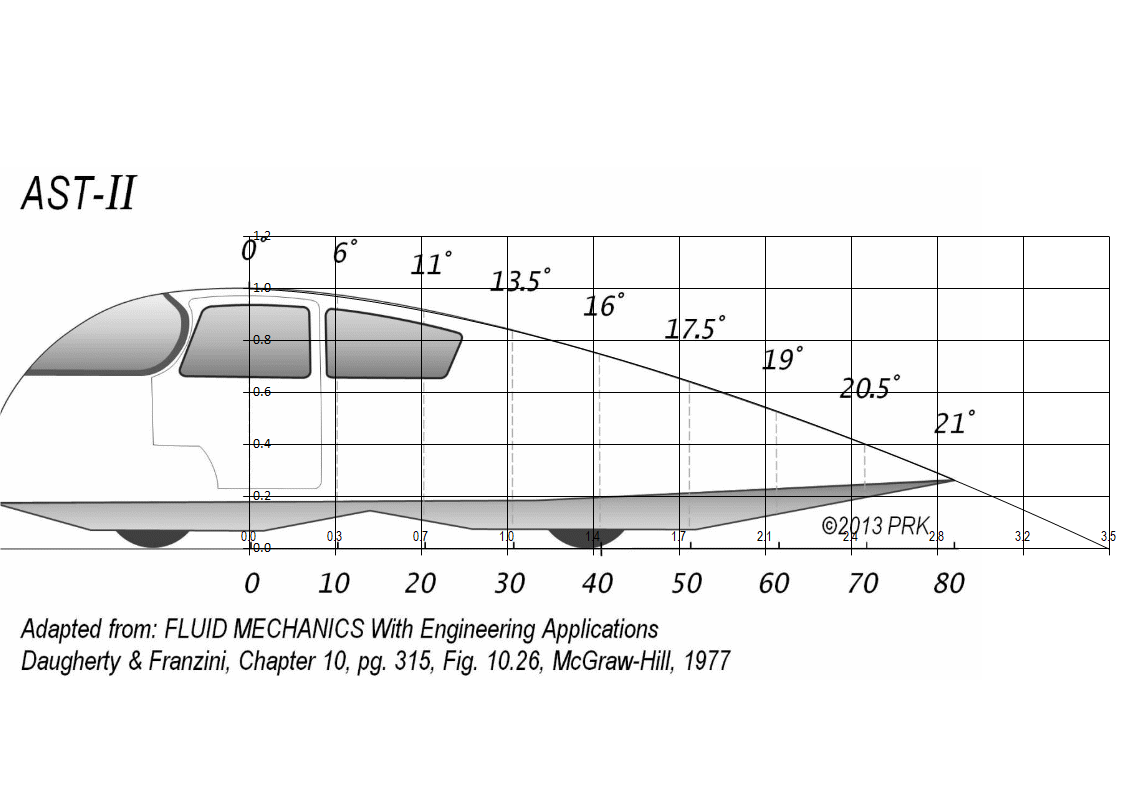
The example shown is 6.8 -23.48 degrees with a 1.78 tail ratio, with the template overlay below I have just lined up the section markers so you see the template image must be accelerating at a greater rate than the angles specified, but we are talking in the decimals here, just for comparison I also did an overlay compressing the curve so it matched template, but this puts the section markers closer together, both images posted below.
No matter how you flip it the match is pretty good and I like the fact of a smooth angle progression.

