View Single Post
Old 10-27-2020, 02:54 PM   #168 (permalink)
jakobnev
Eco-ventor
 
jakobnev's Avatar
 
Join Date: Oct 2010
Location: sweden
Posts: 1,631

Princess - '92 Mazda MX-3 GS
House of Tudor
Team Mazda
90 day: 53.54 mpg (US)

Shirubāarō (*´ω`*) - '05 Toyota Prius Executive
Team Toyota
90 day: 54.88 mpg (US)

Blue Thunder - '20 Hyundai IONIQ Trend PHEV
Team Hyundai
Plug-in Hybrids
90 day: 587.16 mpg (US)
Thanks: 74
Thanked 702 Times in 445 Posts
Send a message via MSN to jakobnev
Quote:
What does the plot line represent?
The line represents 100mpg.

If you have a car that weighs 1000kg then your max drag area is 0.306m².

If the car is small with a frontal area 1.5m², then your max Cd is 0.204.
__________________


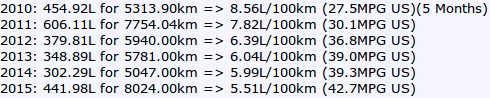
2016: 128.75L for 1875.00km => 6.87L/100km (34.3MPG US)
2017: 209.14L for 4244.00km => 4.93L/100km (47.7MPG US)
  Reply With Quote
The Following User Says Thank You to jakobnev For This Useful Post:
sgtlethargic (10-27-2020)