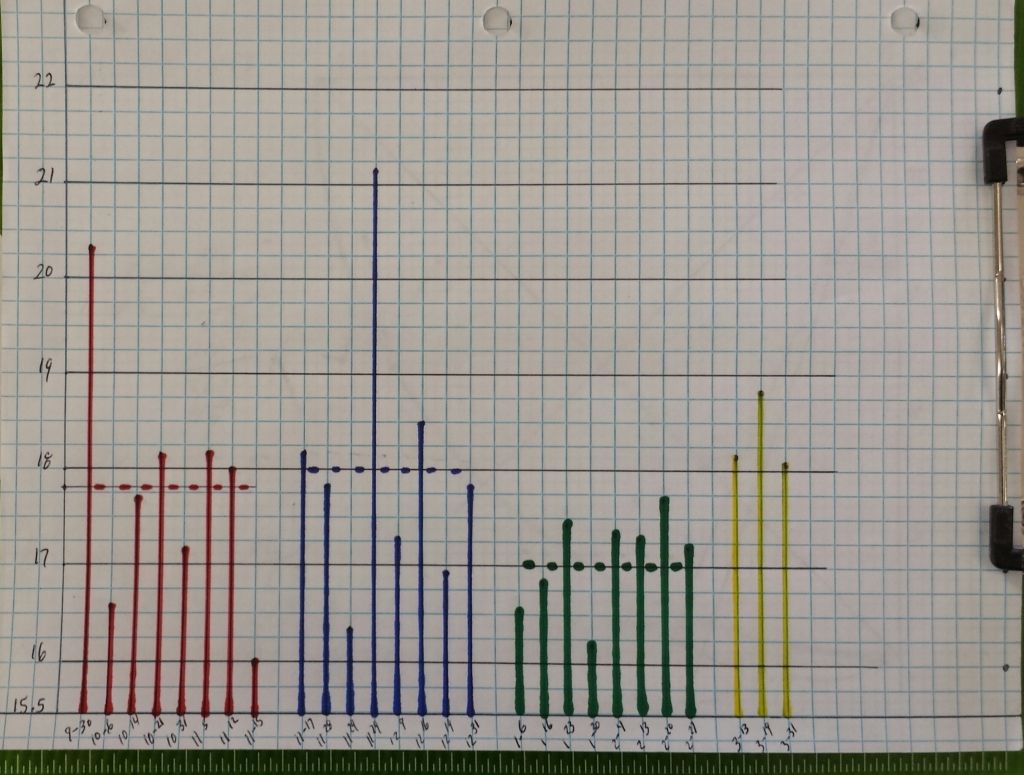
I tried graphing my average MPG for my truck since I bought it in mid September 2014 but I don't think a line graph is the way to go. This morning I set it all up as a bar graph. The graph is split into units of eight since I had 8 fill ups before I installed the aero on the truck in mid November 2014.
The dashed line in each section represents the average of the eight fill ups. This works pretty good as it breaks down my data into two month sections. The last section for March 2015 only has three data points.
I will be filling up again on April 10th just before I leave for Monahans, TX to meet Phil Knox. I will fill up again there then drive around for a few days while we are at the park. This will be trash mileage so I will top off the tank before I leave for home. Then when I get back to Las Cruces, NM I will fill up again.
This will give me seven fill ups and the very next fill on April 18th will give me a full data set of eight which will include the trip to Monahans and back. I will have the boat tail on the vehicle for the trip to Monahans. I only install the Boat Tail for road trips but we drive around all the time with the Aerolid installed.
The trip to Monahans should give us good data on warm weather performance with the aero packages installed. We really did not have good weather conditions on the November trip to Little Rock, AR to pick up the Aerolid and Boat Tail. Air densities were high due to cold temperatures and with luck we should have temps in the 80 F range for the trip to Monahans. Now if only the wind of rather the lack of wind will cooperate.