Hi,
I have a RAM ProMaster van converted into a camper. These are getting popular, and many of the people doing them have large roof racks - mostly to support solar panels. Its been my belief that these racks cause a larger MPG penalty than people realize, and I got curious enough about this to do the test outlined below. The result for the large rack was a drop in MPG of 2.5 on a van that normally gets about 19 MPG - a pretty big hit.
I'd like to do some more testing on alternative rack designs and other aero changes, but wanted to get some
feedback here on the test method I used and advice on how to improve it before spending more time and effort on the project.
This is pretty long, so, I'll ask my questions here at the start...
- Mostly, I'd like feedback on the test method I used, which is detailed below. And, ways to improve it.
- What kind of tolerance would you put on the MPG numbers from the test?
- What might be done to improve the test method?
- Have you seen other data on the MPG effect of roof racks? References?
- Ideas on how to reduce the drag of roof racks? Minimize frontal area? Low drag structural sections? Located far aft? Avoid the area where windshield transitions into roof? Keep rack as close to roof surface as possible?
Thanks in advance for any feedback.
Here are the details on the test:
This page describes a test to determine the fuel use (MPG) penalty for adding two kinds of solar panels to a van roof...
1. A large roof rack for mounting PV panels and other things
2. A PV panel mounted directly to the roof of the van
The roof rack is a fairly large one of about the same size as some commercial and DIY roof racks used to mount arrays of PV panels, or other stuff to the roof.
In the other scheme, the PV panel is a single large 315 watt panel which is mounted directly to the roof with minimal hardware and is mounted far aft and low to (hopefully) reduce drag.
I am the biggest fan of solar, but it has occurred to me that the aero drag created by the solar panel mounted to the roof might outweigh the advantages and energy saving of the solar panel. This test is intended to shed some light on this.
Van SetupSimulated Roof Rack
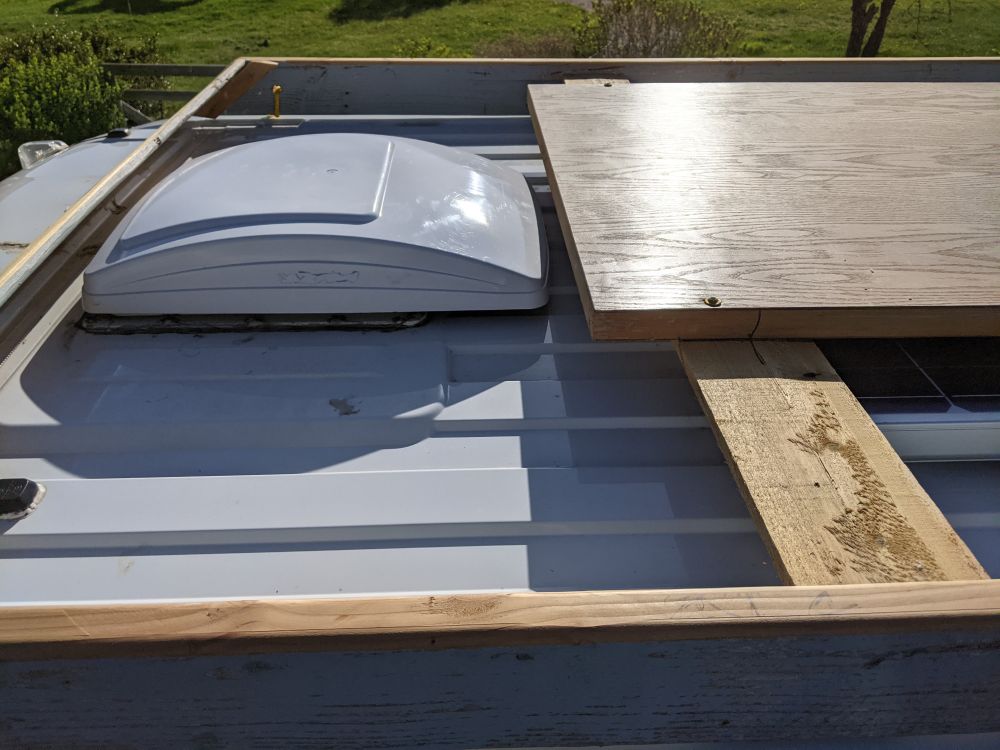
I had planned to just run the MPG test with my current large PV panel against the van without PV panel. But, I figured since I was going to this much effort, might as well test a larger roof rack as well. So, I made a roof rack out of scrap lumber so it could be compared to the PV panel on roof. In all cases my Maxfan was on the roof.

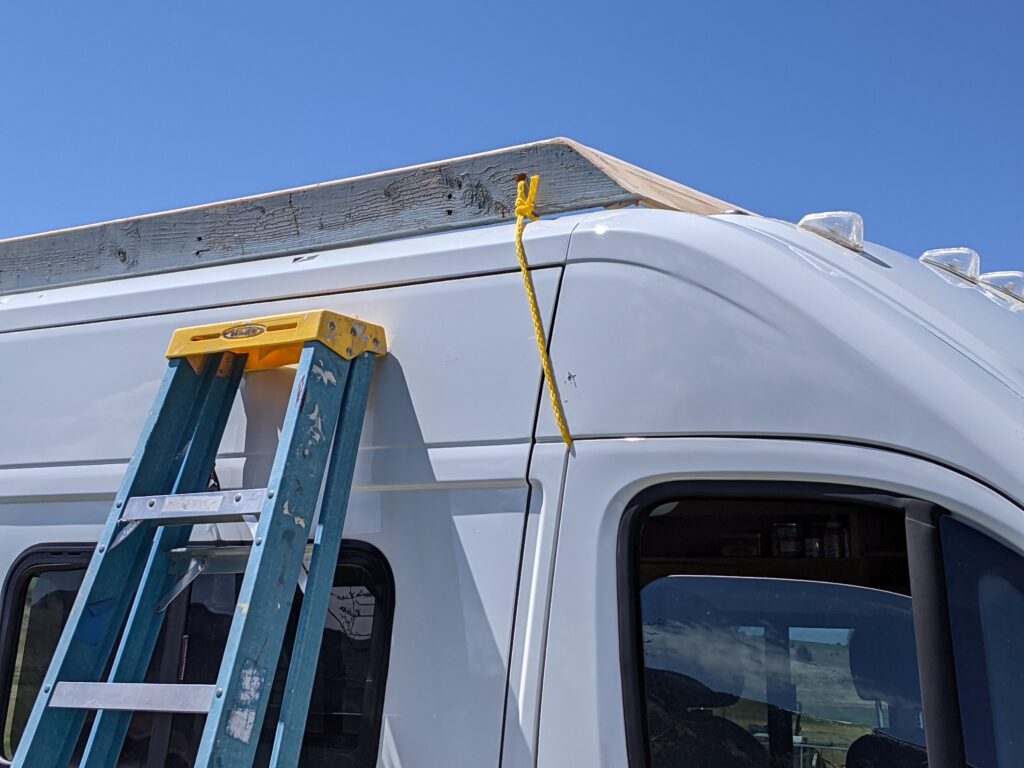
I know this looks kind of goofy, but its what I could do with scrap lumber I had in hand to simulate a full roof rack. The idea is to get about the same frontal area and shape of some existing commercial racks I’ve seen. The door slab mounted on the rack simulates a PV panel that might be mounted on the rack. The rack is 4.5 inches tall by 61 inches wide by 118 inches long. Its held down to the van by ropes at each corner for easy removal with no holes.
The roof rack increases the frontal area of the van by about 4.5%, but maybe more importantly, it increases the drag coefficient of the van — both contribute to increased drag and lower MPG.

The highly sophisticated roof rack mounting method.
PV Panel
Single PV Panel
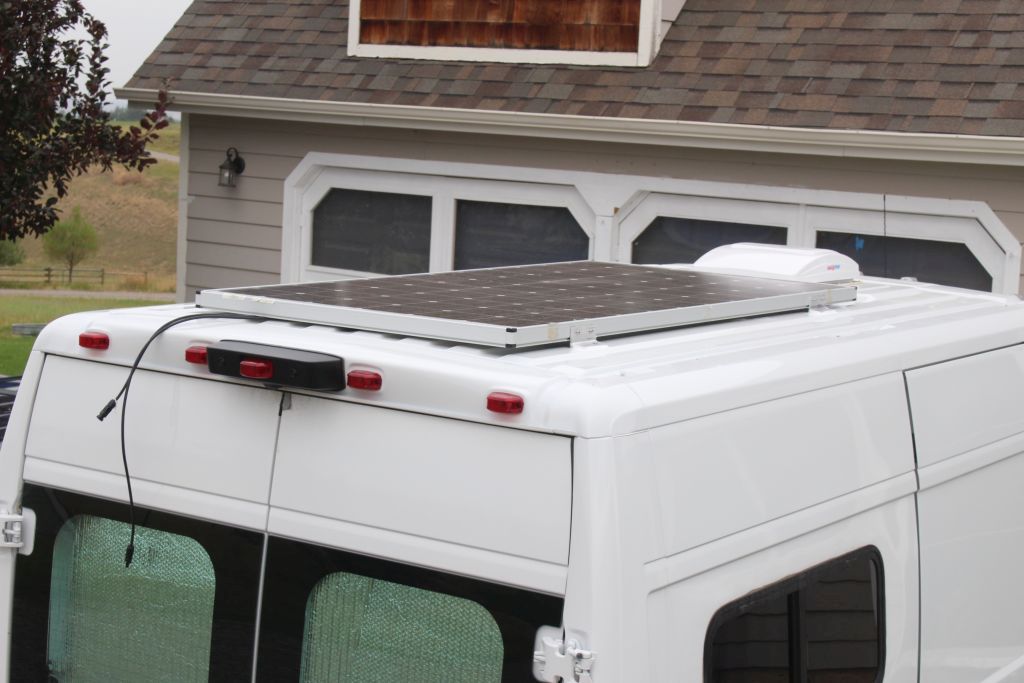
This the 2nd scheme: A large single PV panel that I’ve had mounted on my van since 2014.

The panel is 78 inches long by 39 inches wide by 1 3/4 inches thick. I tried to mount it for low aero drag — that is, lengthwise behind the fan and nearly touching the van roof.
Bare Roof
The final configuration tested was the van with just the Maxfan installed, and the roof bare otherwise. It would have been nice to remove the Maxfan, but too much work for this time.
Test Procedure
This test procedure is what I am most interested in getting some feedback on.
All of the testing was done over about three hours on a low wind, sunny day.
Tires were inflated to 65 psi cold – tire pressure rose to 70 psi for actual test. The van and tires were warmed with an I90 run of 20+ miles before the start of testing. Wind speed was down around 2 mph, and since each run had an east to west followed by a west to east segment, to minimize wind effects.
Each run consisted of a 65.2 MPH run west on I90 between two mile markers, followed by a run east between the same mile markers at the same speed. The ProMaster Trip Computer was used to record the MPG between the mile markers. The length of the run in each direction was 12 miles. The cruise control was used during the full run.
The I90 section used had some flat areas and some modest hills. The van shifted down from 6th gear to 5th gear for short periods on a couple of the small hills. Pretty typical interstate highway driving.
A full run consisted of these steps…
Enter I90 at interchange 288 (Manhattan, MT) going west
“resume” cruise control at 65.2 miles per hour (or set at 65.2 if old setting was lost)
As mile marker 288 is passed, reset Trip A computer.
Drive with as little interference as possible to end mile marker (276) – 12 miles in all.
Note Average MPG on Trip A while passing mile marker 276
Exit at interchange 274 (hwy 287 exit)
Go across I90 and enter I90 going east
“resume” cruise control at 65.2 miles per hour
As mile marker 275 is passed, reset Trip A computer.
Drive with as little interference as possible — 12 miles in all.
Note Average MPG on Trip A at mile marker 288.
Exit I90 at interchange 288.
Each of the three configurations were tested with two of these runs on I90 – six runs total for 144 miles total.
After the first two runs with the full roof rack, I pulled off the road at exit 288, pulled the roof rack off, and stowed it in the van. This left the van with the roof fan and my regular PV panel (39 by 78 inches). I then did two identical runs with the PV panel. I pulled off the road again and removed the PV panel, so that the only thing left on the roof was the roof fan. I then did two more identical runs in this configuration. About 3 hours total. I only had to reset the cruise control once during the whole process, and got it back to 65.2 MPH using the digital readout on my OBD app.
Since all the racks were stowed in the van, there was no change in van weight over the test except for a few pounds of gasoline used. In reality, the large roof rack would also suffer a small hit in MPG due to the weight of the rack – maybe about 0.1 MPG for a 100 lb rack.
I think this works out pretty well as a test method. Resetting the Trip Meter at the start mile marker while already having established stable cruise control speed, and then noting the Trip Average MPG while passing the end mile marker takes away the inconsistencies that would come from including the the less consistent acceleration and deceleration at the start and end of each run. On the previous MPG test for the vortex generators, I also did very careful gas fillups after each two runs as a check on the trip computer, but the two agreed well, so I did not do the fillups this time.
Of course the trip computer on most ProMasters tends to be a bit optimistic, but this does not matter when we are only comparing runs with and without the racks. In the past, when I’ve tested my trip computer, it has been about 0.5 MPG optimistic.
Results
The average MPG with full roof rack was18.75 MPG
The average MPG with PV panel was 21.1 MPG
The average MPG with no panels was 21.2 MPG
So, the full roof rack was 2.5 MPG worse than the roof with only the Maxfan on it.
Over a 200,000 mile van life, this is 1233 gallons extra gas, or at $4 per gallon, almost $5000 in gas, and 12 tons more of CO2 emissions.
About a 12% decrease of MPG compared to the roof with only the Maxfan on it.
The PV panel was 0.1 MPG worse than the roof with only the fan on it.
Over 200,000 mile van life, this is 45 gallons extra gas, or at $3 per gallon $135 in gas, and about half a ton more of CO2 emissions.
The drag penalty for the PV panel over the roof with just the fan seems small to me. I guess its possible that mounting it low to the roof, far back on the roof, with long axis parallel to the van, and in the drag shadow of the fan all worked splendidly and the drag increment is really only 0.1 MPG. Or, maybe the random variations from run to run added up to favor the PV panel. Or, maybe some of each?
It would have been nice to test the bare roof with no fan — maybe some day ��
MPG for all 6 runs:
Roof Rack run 1: West 18.3, East 18.5
Roof Rack run 2: West 19.7, East 18.5
PV panel run1: West 22.6, East 19.6
PV panel run2: West 21.9, East 20.2
No solar run 1: West 23.4, East 19.4
No Solar run 2: West 21.8, East 20.1
I could not find a lot out there on the internet about previous drag tests of roof racks — if you know of any material, please let me know.
This paper: Impact of vehicle add-ons on energy consumption and greenhouse gas emissions Harun Chowdhury*, Firoz Alam, Iftekhar Khan, Victor Djamovski, Simon Watkins
Shows wind tunnel results for various roof mounted stuff, including roof racks. It shows a 20% increase in vehicle drag for one roof rack configuration — substantially more than our test.
Another consideration is the effect of speed. These tests were done at 65.2 MPH. If you speed up to 80 MPH, the drag force goes up by the square of velocity, so it would be up by a factor of (80/65.2)^2 = 1.5. If you assume that at 65 MPH, the aero drag makes up 70% of the total resistance (tire rolling resistance being most of the rest), then you would expect total resistance on speeding up to 80 MPH to go up by a factor of 1.35 and the MPG to go down by the same factor – maybe 14 MPG. On the other hand, if you slow down, MPG improves just as rapidly.
Thoughts on Roof Rack Drag
It seems that just from this little test you could conclude that …
- Roof racks can have a significant impact on van MPG
- The details of how you build a rack and how you mount stuff to the roof can make a large difference in the MPG penalty.
For mounting PV panels, clearly the lowest drag way would be to use one of the flexible PV panels attached to the van roof with adhesive. The MPG penalty for this would likely be near zero.
It appears from the test that the mounting of my single large panel close to the van roof, far back on the roof, behind the roof fan, and lengthwise rather than width wise achieved a pretty low MPG penalty.
If going for a full size roof rack, I think the details of how the rack is built could make a significant difference. Tubular racks with lots of open area should help. For the tubes that face the airstream, using elliptical tubing could help, as cylinders have a much high drag coefficient than elliptical tubes or airfoil shaped tubes. Some of the car manufacturers have picked up on this for car rack cross bars. See this video on the Yakima Whispbar.
It would be nice if one of the commercial roof rack producers would get into this, do some testing, and come out with low drag racks for the ProMaster and other like vans along with some test data to support how good it is.
Its tempting to think that doing without solar and just letting the van alternator charge the battery would save gasoline and energy, but you burn extra gasoline to generate energy with the alternator. VERY roughly: If you assume 1) 60 days of van use per year, 2) a need to generate 100 amp-hrs of battery charging per day, 3) an overall efficiency of 20% for the engine charging system, this leads to using using an extra 0.17 gallons of gasoline per day of use, or 10 gallons a year for 60 days of use, or 150 gallons for the 15 year life of the van. This is probably more than the extra gasoline used by a carefully mounted PV panel capable of generating the same 100 amp-hrs per day — and, you have all the other advantages of solar.
It seems like the energy use and carbon emissions winner is the flexible PV panel glued to the van roof.
If you know of any additional test or analysis on this subject, or have any thoughts, please leave them in the comment section.
Gary