Quote:
Originally Posted by TestDrive

|
Good find, that post on TDIclub is some good reading on the subject.
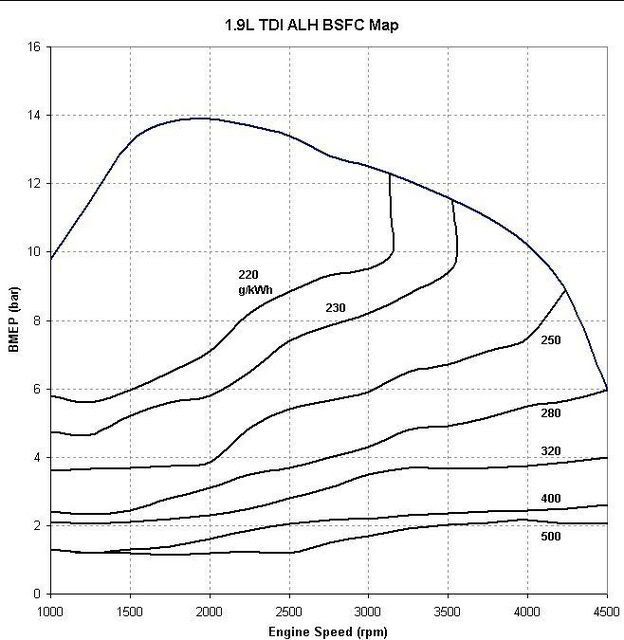
Thanks to all that have posted in this thread too, interesting discussion. And I really appreciate finding the BSFC map for my engine! As soon as I saw it I knew I had to start experimenting in excel. Unfortunately, not having the data meant re-creating it. Didn't take long though: Pretty close, I'd say.
from:
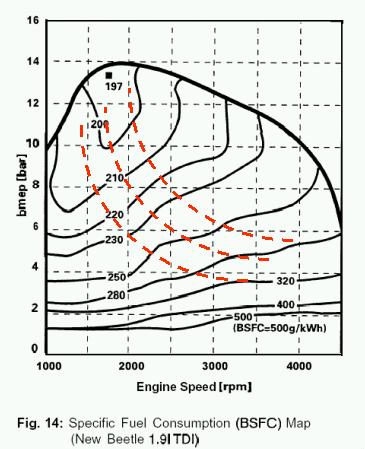
to:
For some background: BMEP (brake mean effective pressure) is directly comparable to torque, regardless of engine speed. I wont try to type formulas here, but you basically just relate torque to the mean pressure acting downwards on the piston times displacement and divided by 4*pi.
With units of bar (= 100 kPa), the result is torque in N-m (newton-meters).
BMEP is most often simply calculated from the brake torque as measured on an engine dynamometer. It becomes very useful when you measure the actual cylinder pressure with a transducer, calculate the indicated mean effective pressure (IMEP), and subtract the BMEP to obtain the FMEP, or friction losses of the engine due to rubbing, rotating, accessory drives, and pumping losses.
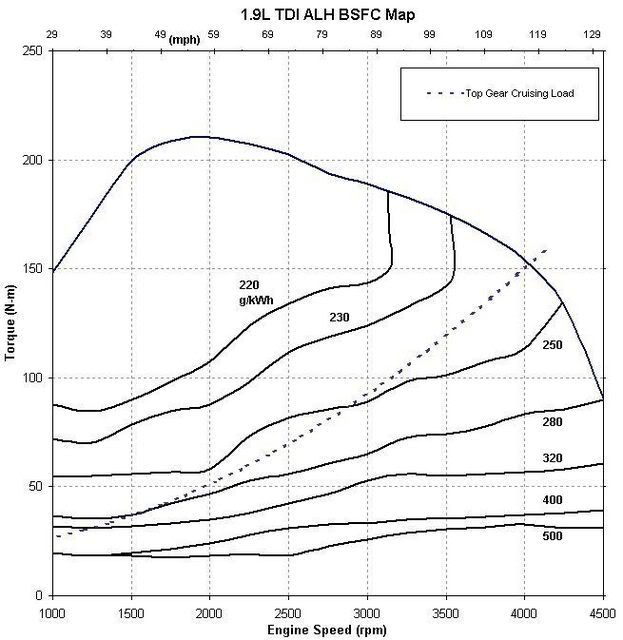
Now that we have a decently accurate BSFC map set of data, we can overlay other data for comparison. For example, the lines of constant power in blue on the 2nd version of this plot. While those are neat for reference, they aren't especially practical, since you cant just adjust your rpm while driving down the road to maximize efficiency. (of course gearing changes do this though - more on that later).
I decided to look at the power requirements due to real road loads when traveling in top gear (where I do most of my driving). I was going to calculate a bunch of stuff when I found the aerodynamic and rolling resistance HP loss calculator on this site, very handy!
Aerodynamic & rolling resistance, power & MPG calculator - EcoModder.com
My input data:
VW Jetta Mk4
weight = 3300 lbs
Cd = 0.30
Crr = 0.010
Area = 21.8 ft^2
Fuel = B20 biodiesel
Air Density = 1.293 kg/m^3 (0 C)
very cool. Copied the data out and pasted into excel. Now we have the aerodynamic and rolling losses calculated from 5 to 120 mph.
Next, I calculated the engine rpm in top gear when traveling through that same speed range with my tire size and gear ratio #s. If we assume we're stuck in 5th gear, we can overlay a plot of the aero and rolling load on the vehicle vs engine rpm. The calculated HP loss is converted to torque through rpm. Vehicle speed is on the top axis for reference.
But what if we can lower our aerodynamic drag? My goal for my jetta is to get down to Cd = 0.27. Probably optimistic given how good it is to start with. We'll see (mirror delete and other tricks on the way this spring).
Re-calculating, we can compare.
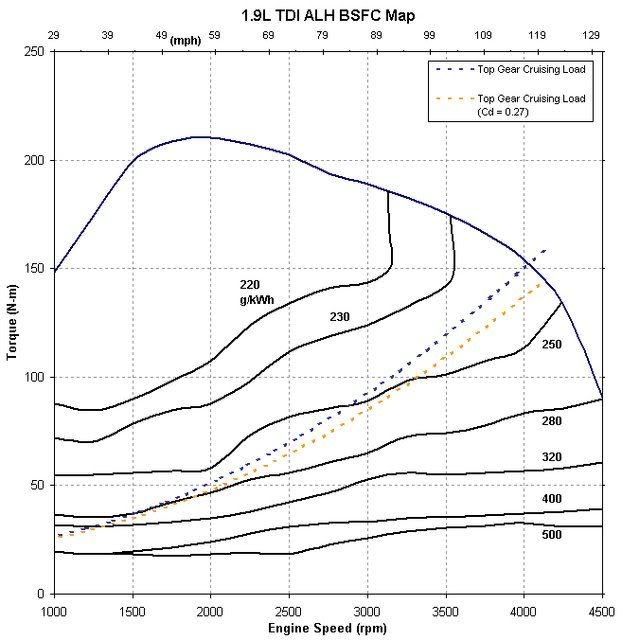
So you can see that reducing our road load with the same vehicle gearing, we are actually moving the engine operation into a less efficient area. Bad thing? No way! because even though the efficiency has declined for the same vehicle speed, we are requesting less load and our overall fuel consumption has still declined. I ran a comparison calculation:
Traveling at 2500rpm = 72.5 mph
I fit 2nd order polynomials to the aero and rolling calculation lines (R^2 = 1). Back calculating real road load at this speed, converting to power @ 2500rpm, and interpolating between BSFC lines to estimate the specific fuel consumption, we generate the following data:
2500 rpm = 72.5 mph
Cd Nm kW BSFC est g/hr L/h gal/h mpg
0.30 69.21 18.11 263 4762.91 5.60 1.48 48.98
0.27 64.48 16.87 269 4538.95 5.34 1.41 51.39
Pretty darn cool, especially since the calculated fuel consumption matches what I record in driving nearly perfectly (the 49 mpg, that is). So we can now calculate directly the effect that a given aero improvement will have upon mileage! nice. Interpolating between the BSFC lines is a little bit of a guesstimation, but its the best we can do.
Next up: Gearing reductions through a swapped out 5th gear or tire size changes! I'll try to post up these comparisons on Monday. hint: the road load lines move to the left.


 Today
Today