12-03-2011, 02:50 AM
|
#11 (permalink)
|
|
Pishtaco
Join Date: Jun 2009
Location: Bay Area, California
Posts: 1,485
Thanks: 56
Thanked 286 Times in 181 Posts
|
Thanks, David. I'll have to check whether the SGII's performance mode monitors TFC.
I agree better resolution would be nice. I started by monitoring liters per hundred kilometers, but changed to GPH for this past round of testing. I suspect the available resolution using GPH is adequate for my purpose of determining best acceleration load.
__________________
Darrell
Boycotting Exxon since 1989, BP since 2010
Have you ever noticed that anybody driving slower than you is an idiot, and anyone going faster than you is a maniac? George Carlin
Mean Green Toaster Machine
49.5 mpg avg over 53,000 miles. 176% of '08 EPA
Best flat drive 94.5 mpg for 10.1 mi
Longest tank 1033 km (642 mi) on 10.56 gal = 60.8 mpg

|
|
|

|
|
The Following User Says Thank You to SentraSE-R For This Useful Post:
|
|
 Today Today
|
|
|
|
 Other popular topics in this forum...
|
|
|
|
|
12-04-2011, 12:36 AM
|
#12 (permalink)
|
|
Pishtaco
Join Date: Jun 2009
Location: Bay Area, California
Posts: 1,485
Thanks: 56
Thanked 286 Times in 181 Posts
|
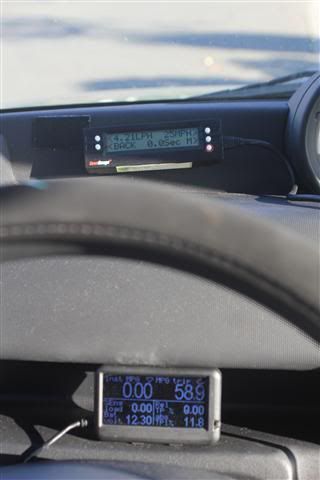
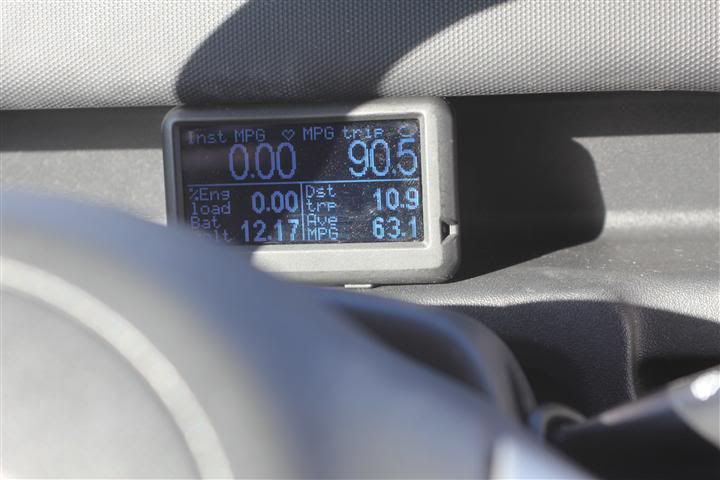
Old Tele, for sure, that would be nice. A savvy person might be able to daisy chain another device using the other RJ-45 port on the SG.
Here's a photo of my SG/UG data logging setup.
Quote:
Originally Posted by SentraSE-R

A typical glide from 40-25 mph in my boxy (8.77 CdA) xB is ~30 seconds, and almost every subcompact to mid-size car does better. Adding a 30 second glide to the data yields the following results:

The results get better with lower speeds. My pulse:glide ratio is 1:3 (10:30) in fourth gear 25-40 mph P&G. It's 1:5 (8:40) in third gear 15-32 mph P&G. It's 1:10 (3:30) in second gear 11-25 mph P&G. |
I tried David's suggestion to log TFC after setting my fuel cost to $10/gallon. Unfortunately, it did not vary a bit from $1.03 during the entire pulse cycle, even after I went into EOC. Scratch that idea.
I ran two 95% LOD pulses, one logging GPH, and one logging LPH. I was pleasantly surprised to find I could simply set my fluid measurements to liters, leaving distance in miles, and then I could log LPH. When/if I convert the data to GPH or MPG, or keep them as LPHK, the LPH data show more resolution. The LPH fuel usage goes from 0.07 to 10.9, v. the GPH range from 0.02 to 2.81
Using the GPH data below for comparison with the figures above, I used more fuel for the same period of time to accelerate the same speed over the same distance at 95% LOD.
0.004774444 sum gas used in pulse
19 # intervals 7.6 time to pulse
12/3/11 95% LOD P&G 25-40. 60 degrees, sunny, dry. Wind quartering rear 25-40 mph.
After I finished the 95% LOD runs, I played with some 10-25 mph P&G. Here are the results (sea level flat drive).
__________________
Darrell
Boycotting Exxon since 1989, BP since 2010
Have you ever noticed that anybody driving slower than you is an idiot, and anyone going faster than you is a maniac? George Carlin
Mean Green Toaster Machine
49.5 mpg avg over 53,000 miles. 176% of '08 EPA
Best flat drive 94.5 mpg for 10.1 mi
Longest tank 1033 km (642 mi) on 10.56 gal = 60.8 mpg
Last edited by SentraSE-R; 12-04-2011 at 12:50 AM..
|
|
|
|
|
The Following User Says Thank You to SentraSE-R For This Useful Post:
|
|
|
12-08-2011, 02:08 PM
|
#13 (permalink)
|
|
Master EcoModder
Join Date: Jan 2011
Location: na
Posts: 1,025
Thanks: 277
Thanked 218 Times in 185 Posts
|
Just out of curiosity, what is you MPG at 32 mph in 4th gear?
|
|
|
|
|
12-08-2011, 05:22 PM
|
#14 (permalink)
|
|
Pishtaco
Join Date: Jun 2009
Location: Bay Area, California
Posts: 1,485
Thanks: 56
Thanked 286 Times in 181 Posts
|
I get ~51-52 mpg @ 32 mph in 4th gear, and ~55 mph @ 32 mph in 5th gear.
__________________
Darrell
Boycotting Exxon since 1989, BP since 2010
Have you ever noticed that anybody driving slower than you is an idiot, and anyone going faster than you is a maniac? George Carlin
Mean Green Toaster Machine
49.5 mpg avg over 53,000 miles. 176% of '08 EPA
Best flat drive 94.5 mpg for 10.1 mi
Longest tank 1033 km (642 mi) on 10.56 gal = 60.8 mpg
|
|
|
|
|
12-08-2011, 07:17 PM
|
#15 (permalink)
|
|
Master EcoModder
Join Date: Jan 2011
Location: na
Posts: 1,025
Thanks: 277
Thanked 218 Times in 185 Posts
|
Thanks, I was curious how much the P&G EOC effort is worth. It can save quite a bit, but you have to know what your doing. 20 mpg gain when comparing 5th gear 32 mph vs 90% 4th gear P&G, down to almost 0 gain at 70%LOD.
|
|
|
|
|
12-09-2011, 04:43 PM
|
#16 (permalink)
|
|
1994 geo metro xfi60 mpg
Join Date: Oct 2011
Location: Denver, Co.
Posts: 4
Thanks: 0
Thanked 0 Times in 0 Posts
|
Well older cars like my 1994 Geo cant get a scan guage.. Kinda stinks wish it could :-(
|
|
|
|
|
01-18-2012, 03:16 PM
|
#17 (permalink)
|
|
Pishtaco
Join Date: Jun 2009
Location: Bay Area, California
Posts: 1,485
Thanks: 56
Thanked 286 Times in 181 Posts
|
You can install an MPGuino. Unfortunately, you have to be a geek to know where to tap into your VSS, and to configure the MPGuino correctly.
__________________
Darrell
Boycotting Exxon since 1989, BP since 2010
Have you ever noticed that anybody driving slower than you is an idiot, and anyone going faster than you is a maniac? George Carlin
Mean Green Toaster Machine
49.5 mpg avg over 53,000 miles. 176% of '08 EPA
Best flat drive 94.5 mpg for 10.1 mi
Longest tank 1033 km (642 mi) on 10.56 gal = 60.8 mpg
|
|
|
|
|
01-18-2012, 05:05 PM
|
#18 (permalink)
|
|
...beats walking...
Join Date: Jul 2009
Location: .
Posts: 6,190
Thanks: 179
Thanked 1,525 Times in 1,126 Posts
|
...anyway to get both GPH and INCLINE ANGLE info collected and plotted against one another?
...maybe, GPH from SG or UG, and ANGLE from ipad/smart phone, etc.?
|
|
|
|
|
01-22-2012, 07:52 AM
|
#19 (permalink)
|
|
EcoModding Lurker
Join Date: Jan 2012
Location: Gosford
Posts: 49
Thanks: 3
Thanked 1 Time in 1 Post
|
WOW... Ground breaking stuff. .. ...
Quote:
Originally Posted by SentraSE-R
We now have the ability to determine fuel consumption during acceleration under different engine loads. Its not cheap, as it requires you have access to a Scangauge II with v. 4.06 performance upgrade, a second SG or UG to show engine load during testing, and a cable to piggyback the two devices. I got my SGII v. 3.17 upgraded by Linear Logic for $18 under the Ecomodder Group Buy (regular price for the upgrade is $25).
The upgraded SG-II adds performance data logging, so SG owners can log fuel consumption during cruising and acceleration. I thought I could test fuel consumption during acceleration pulses with the SG alone, but in performance logging mode, it uses all available displays to show time, distance, speed, etc. That meant I couldnt display engine load to keep acceleration consistent. I already own an UG, so I bought an OBD-II cable splitter, with one J1962M end and two J1962F ends, to plug both my SG-II and UG into my 2006 Scion xB. The UG was used solely to display % engine load during data collection. The SG collected performance data.
SG performance mode automatically logs speed, distance, and time (every .4 seconds for 24 seconds) , plus one user-selected parameter. For the testing, I chose GPH as my user-selected parameter, since the logged time intervals are consistent, while fuel consumption logged as MPG varies with varying distances traveled at different speeds during pulses.
I did three test runs in the same direction in the same location on the same day, November 23, 2011. The road was dry, temperature was 55 degrees F, winds <10 mph, skies cloudy and overcast. I accelerated from 25-40 mph in 4th gear on each run, and added the fuel consumption for the cumulative time during each pulse. One pulse was at 82% LOD, one at 90% LOD, and one at 70% LOD. Ive been using 83% LOD in my 1NZ-FE engine, having determined long ago that it gives better results than 75% LOD. After each run, I transferred the data to a notebook and then to a spreadsheet.
Following are performance data from my 82% LOD pulse. First column is elapsed time. Second column is GPH fuel consumption rate. Third column is distance traveled. Fourth column is speed. Fifth column is actual fuel consumed during the 0.4 second time interval, calculated from the GPH rate. If Im burning fuel at 1.51 GPH, Ill consume 1/3600 of 1.51 gal. in 1 second, and 1/9000 of 1.51 gal, or .00168 gal. in .4 sec.
4 1.51 131 24 0.000168
4.4 1.54 145 25 0.000171
4.8 1.57 159 26 0.000174
5.2 1.57 175 26 0.000174
5.6 1.6 190 27 0.000178
6 1.61 206 27 0.000179
6.4 1.61 222 27 0.000179
6.8 1.65 237 28 0.000183
7.2 1.65 254 29 0.000183
7.6 1.7 271 29 0.000189
8 1.7 289 29 0.000189
8.4 1.8 306 29 0.0002
8.8 1.83 323 30 0.000203
9.2 1.84 341 30 0.000204
9.6 1.86 359 32 0.000207
10 1.89 377 32 0.00021
10.4 1.89 396 32 0.00021
10.8 1.93 414 33 0.000214
11.2 1.93 434 33 0.000214
11.6 2 453 34 0.000222
12 2 473 35 0.000222
12.4 2.08 494 35 0.000231
12.8 2.11 515 35 0.000234
13.2 2.12 535 35 0.000236
13.6 2.12 556 37 0.000236
14 2.16 578 38 0.00024
14.4 2.16 600 38 0.00024
14.8 2.21 622 39 0.000246
15.2 2.21 645 39 0.000246
From the data, I used .005963 gal. gas during 11.6 seconds (29 X 0.4 second intervals) to pulse 25-40 mph at 83% LOD. I used .004688 gal. during 7.6 seconds (19 X 0.4 second intervals) to pulse 25-40 mph at 90% LOD. I used .007563 gal. during 16.8 seconds (42 X 0.4 second intervals) to pulse 25-40 mph at 70% LOD. I had guessed from the collective wisdom here that 90% LOD acceleration would waste gas. I was wrong. We have a better tool than seat of the pants and variable-filled ABA P&G testing to determine best acceleration loads. Its the Scangauge II with performance upgrade.
Im including the 90% and 70% LOD data for your perusal. First, the 90% LOD data.
3.2 1.6 110 25 0.000178
3.6 1.62 125 25 0.00018
4 2.05 140 27 0.000228
4.4 2.04 156 28 0.000227
4.8 2.04 172 29 0.000227
5.2 2.04 189 29 0.000227
5.6 2.04 206 29 0.000227
6 2.19 223 29 0.000243
6.4 2.19 240 30 0.000243
6.8 2.22 258 32 0.000247
7.2 2.33 277 33 0.000259
7.6 2.33 296 33 0.000259
8 2.44 316 33 0.000271
8.4 2.46 335 34 0.000273
8.8 2.46 355 35 0.000273
9.2 2.48 376 37 0.000276
9.6 2.48 397 37 0.000276
10 2.59 419 37 0.000288
10.4 2.59 440 38 0.000288
Then the 70% LOD data.
2 1.45 71 25 0.000161
2.4 1.45 86 25 0.000161
2.8 1.43 100 25 0.000159
3.2 1.19 115 26 0.000132
3.6 1.12 130 26 0.000124
4 1.19 146 27 0.000132
4.4 1.2 162 27 0.000133
4.8 2.2 178 27 0.000244
5.2 1.54 194 29 0.000171
5.6 1.54 211 29 0.000171
6 1.56 227 29 0.000173
6.4 1.56 244 29 0.000173
6.8 1.59 261 30 0.000177
7.2 1.62 278 30 0.00018
7.6 1.52 296 30 0.000169
8 1.5 313 31 0.000167
8.4 1.48 332 31 0.000164
8.8 1.54 350 31 0.000171
9.2 1.54 368 31 0.000171
9.6 1.54 386 31 0.000171
10 1.52 405 32 0.000169
10.4 1.52 424 32 0.000169
10.8 1.57 442 34 0.000174
11.2 1.57 462 34 0.000174
11.6 1.55 482 34 0.000172
12 1.61 502 34 0.000179
12.4 1.69 522 34 0.000188
12.8 1.71 542 35 0.00019
13.2 1.71 562 34 0.00019
13.6 1.71 582 34 0.00019
14 1.77 602 36 0.000197
14.4 1.77 623 36 0.000197
14.8 1.75 644 36 0.000194
15.2 1.75 666 36 0.000194
15.6 1.83 687 36 0.000203
16 1.84 708 37 0.000204
16.4 1.87 730 37 0.000208
16.8 1.89 752 39 0.00021
17.2 1.87 774 39 0.000208
17.6 1.87 797 39 0.000208
18 1.97 819 39 0.000219
18.4 1.97 842 39 0.000219
In summary, I used .005963 gal. during an 11.6 second 25-40 mph pulse at 83% LOD, v..004688 gal. during 7.6 seconds at 90% LOD &.007563 gal. during 16.8 seconds at 70% LOD.
|
I Have been waiting for soooooo long for devices and 'formulars' to calculate fuel usage on such a fine scale.... Woo-bloody-Hoo ! !! !!!  |
|
|
|
|
01-22-2012, 01:20 PM
|
#20 (permalink)
|
|
Pishtaco
Join Date: Jun 2009
Location: Bay Area, California
Posts: 1,485
Thanks: 56
Thanked 286 Times in 181 Posts
|
Quote:
Originally Posted by Old Tele man
...anyway to get both GPH and INCLINE ANGLE info collected and plotted against one another?
...maybe, GPH from SG or UG, and ANGLE from ipad/smart phone, etc.?
|
It doesn't matter for my tests, since I used the same stretch of road going the same direction, on the same day. And while we know the engine load will be higher, and pulse times will be longer on an incline (and load will be lower/pulse times shorter on a decline), there's no reason to expect the relative fuel consumption at each load to differ.
Yes, fastegg. I think it's ground breaking, too. I guess it's too technical, or too much work, or too expensive. I'm somewhat disappointed in the lack of interest/lack of comments returned on such breakthrough knowledge.
__________________
Darrell
Boycotting Exxon since 1989, BP since 2010
Have you ever noticed that anybody driving slower than you is an idiot, and anyone going faster than you is a maniac? George Carlin
Mean Green Toaster Machine
49.5 mpg avg over 53,000 miles. 176% of '08 EPA
Best flat drive 94.5 mpg for 10.1 mi
Longest tank 1033 km (642 mi) on 10.56 gal = 60.8 mpg
|
|
|
|
|
The Following User Says Thank You to SentraSE-R For This Useful Post:
|
|
|