Go Back   EcoModder Forum > EcoModding > Instrumentation
Register Now
 Register Now
 

Reply  Post New Thread
 
Submit Tools LinkBack Thread Tools
Old 10-12-2020, 10:54 AM   #1 (permalink)
Moderator
 
Vman455's Avatar
 
Join Date: Feb 2012
Location: Urbana, IL
Posts: 1,935

Pope Pious the Prius - '13 Toyota Prius Two
Team Toyota
SUV
90 day: 51.62 mpg (US)

Tycho the Truck - '91 Toyota Pickup DLX 4WD
90 day: 22.22 mpg (US)
Thanks: 198
Thanked 1,797 Times in 937 Posts
Difference in displayed vs measured MPG: Statistical Analysis

In the garage, I have recorded the MPG displayed on the factory gauge for almost every fillup. Leaving out the two I missed, there are 178 fills with these data. Since I'm taking a statistics course this semester, I thought it would be fun to run a simple analysis. Here's what I found:


Using the quartile method to identify outliers, I removed two data: the two times when the factory display underestimated calculated MPG. The remaining 176 fills chart nicely into a normal curve.

Median = 3.0 MPG difference
Mean = 3.04 MPG difference


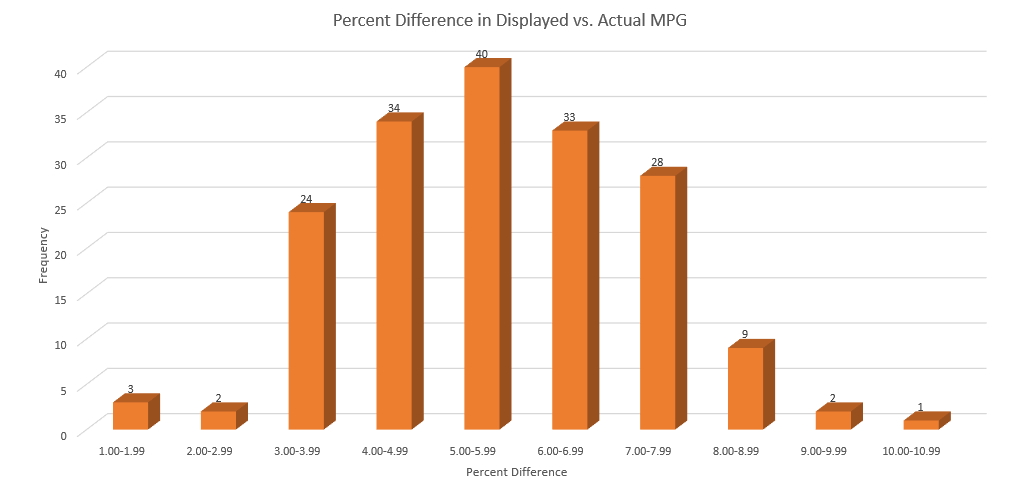
Percent difference shows an even clearer normal curve, and again median and mean are very close to each other.

Median = 5.58% difference
Mean = 5.563% difference

__________________
UIUC Aerospace Engineering
www.amateuraerodynamics.com
  Reply With Quote
The Following User Says Thank You to Vman455 For This Useful Post:
M_a_t_t (10-16-2020)
Alt Today
Popular topics

Other popular topics in this forum...

   
Reply  Post New Thread


Thread Tools


Powered by vBulletin® Version 3.8.11
Copyright ©2000 - 2024, vBulletin Solutions Inc.
Content Relevant URLs by vBSEO 3.5.2
All content copyright EcoModder.com