Go Back   EcoModder Forum > EcoModding > General Efficiency Discussion
Register Now
 Register Now
 

Reply  Post New Thread
 
Submit Tools LinkBack Thread Tools
Old 07-29-2013, 12:04 PM   #241 (permalink)
Master EcoModder
 
ever_green's Avatar
 
Join Date: May 2011
Location: Toronto
Posts: 264

gueff - '19 Mercedes Benz A250 4MATIC AMG
90 day: 30.55 mpg (US)
Thanks: 8
Thanked 79 Times in 33 Posts
Quote:
Originally Posted by WD40 View Post
ever green: the one you list as 1.8L honda sohc i-vtec (2006 140hp civic)
is the same one that tom o shows for the VX
http://www.thelic.org/users/tomo/CivicVXdyno.jpg
what I really want to know is how to understand what its showing.
Can someone explain how to read it?
thanks Dennis
it just means you are better off fuel economy wise operating at 3500 rpm when accelerating at full throttle. in reality something like 2/3 throttle at 2500 rpm would be more efficient. Lots of stuff can happen at full throttle including open loop enrichment or throttle tip enrichment...ignition retardation due to knock. I personally use my scangauge 2 to monitor my acceleration. I accelerate at ~23 deg IGN and/or 70% engine load at 2500 rpm.

__________________
  Reply With Quote
The Following 2 Users Say Thank You to ever_green For This Useful Post:
RH77 (10-14-2013), WD40 (07-29-2013)
Alt Today
Popular topics

Other popular topics in this forum...

   
Old 07-29-2013, 01:18 PM   #242 (permalink)
Master EcoModder
 
Join Date: Jul 2008
Location: Silly-Con Valley
Posts: 1,479
Thanks: 201
Thanked 262 Times in 199 Posts
Quote:
Originally Posted by WD40 View Post
what I really want to know is how to understand what its showing.
Can someone explain how to read it?
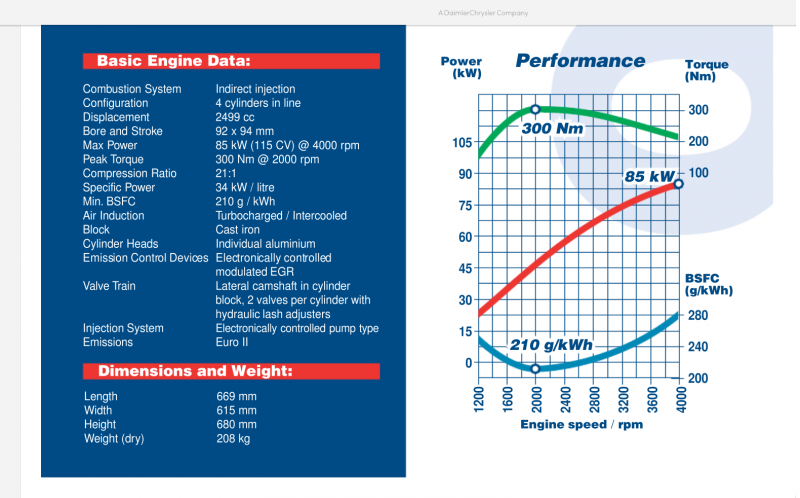
It is three graphs on one page. Each graph uses RPM for the X-axis, but they all have different measurements for the Y-axis.

One line is the maximum torque produced by the engine--at WOT (Wide Open Throttle). This is the one that goes roughly across the middle of the page, and its Y scale is at the right. It ranges from about 12 kg*m at 1000 RPM, to just under 18 kg*m at 5000 RPM.

One line is the maximum horsepower produced by the engine at WOT. This is the line that goes up to the right, and its scale is at the left side of the page. It ranges from less than 20 HP at 1000 RPM to just over 140 HP at 6500 RPM.

The line near the bottom of the page is the BSFC at WOT as well. Its scale is also at the right of the page. It looks to go from just over 250 grams/horsepower*hour at both 1000 and 6500+ RPM, down to about 220 gm/hp*hr at 3000 RPM.

This last line is what we, as efficiency enthusiasts, are interested in. But it isn't enough information (there is NEVER ENOUGH INFORMATION! ) because it only tells us about WOT. To determine the best acceleration range, we would need a BSFC map that shows BSFC at all throttle positions, not just WOT.

The graph is helpful, but a full map would be much better.

-soD
  Reply With Quote
The Following User Says Thank You to some_other_dave For This Useful Post:
WD40 (07-29-2013)
Old 07-29-2013, 01:28 PM   #243 (permalink)
home of the odd vehicles
 
rmay635703's Avatar
 
Join Date: Jun 2008
Location: Somewhere in WI
Posts: 3,882

Silver - '10 Chevy Cobalt XFE
Thanks: 500
Thanked 865 Times in 652 Posts
Has any ever found a BSFC chart comparing different AFR ratios to one another for ANY motor?
  Reply With Quote
Old 09-05-2013, 08:52 PM   #244 (permalink)
EcoModding Apprentice
 
ERTW's Avatar
 
Join Date: Jan 2012
Location: Toronto
Posts: 130

Bu - '08 Chevrolet Malibu LS
90 day: 32.29 mpg (US)
Thanks: 52
Thanked 73 Times in 36 Posts
Another key is anti-tuning. Tuning an intake manifold boost VE, and hence fuel usage (keeping bsfc constant). If you take your 12" long runners, and cut them to 4", you lower VE and boost fuel economy.

Late intake valve closing (Atkinson) reduces pumping loss, and hurts low speed VE (retard the cam a tooth or two). This lowers dynamic compression - the source of the power loss - so you can raise CR to bring back performance, and boost adiabatic and fuel conversion efficiency. Slap a turbo on to bring performance to standard, and you have a Miller engine.
__________________
“Soft shapes follow us through life. Nature does not make angles. Hips and bellies and breasts — all the best designers have to do with erotic shapes and fluidity of form.” - Luigi Colani
  Reply With Quote
Old 10-27-2013, 12:06 PM   #245 (permalink)
Master EcoModder
 
ever_green's Avatar
 
Join Date: May 2011
Location: Toronto
Posts: 264

gueff - '19 Mercedes Benz A250 4MATIC AMG
90 day: 30.55 mpg (US)
Thanks: 8
Thanked 79 Times in 33 Posts
Toyota/Lexus 2GR-FSE fuel consumption map

__________________
  Reply With Quote
Old 12-10-2013, 12:29 PM   #246 (permalink)
EcoModding Lurker
 
Join Date: Nov 2013
Location: lakewood, co, usa
Posts: 53

subey - '99 Subaru Impreza Outback Sport

rav4 - '07 Toyota Rav4
Thanks: 3
Thanked 1 Time in 1 Post
ford eco-boost

Some interesting charts on the ford eco-boost. Including some BSFC charts, but they are not complete.

http://www.umtri.umich.edu/content/Dan.Kapp.Ford.pdf
http://www1.eere.energy.gov/vehicles...ich_2011_o.pdf
  Reply With Quote
The Following User Says Thank You to bikenfool For This Useful Post:
mort (12-10-2013)
Old 12-19-2013, 10:20 PM   #247 (permalink)
EcoModding Lurker
 
betasniper's Avatar
 
Join Date: Feb 2013
Location: California
Posts: 79

Red - '01 Honda Insight CVT
Gen-1 Insights
House of Tudor
Team Honda
90 day: 59.17 mpg (US)

Civic Hybrid - '12 Honda Civic Hybrid
Team Honda

Bahamut - '18 Chevrolet Volt LT
Team Volt
Plug-in Hybrids
Thanks: 6
Thanked 48 Times in 23 Posts


I cleaned the Saturn 1.9L BSFC (DOHC), included imperial units, Constant Horsepower curves, Engine Load %, and extrapolated to redline.

Magenta Line is "Optimum Efficiency Line"
Attached Thumbnails
Click image for larger version

Name:	Saturn BSFC.jpg
Views:	1254
Size:	93.4 KB
ID:	25557  
__________________

: Brothers
: Dad's

Last edited by betasniper; 02-21-2019 at 10:10 PM..
  Reply With Quote
The Following User Says Thank You to betasniper For This Useful Post:
cfg83 (12-22-2013)
Old 02-11-2014, 12:20 AM   #248 (permalink)
EcoModding Lurker
 
betasniper's Avatar
 
Join Date: Feb 2013
Location: California
Posts: 79

Red - '01 Honda Insight CVT
Gen-1 Insights
House of Tudor
Team Honda
90 day: 59.17 mpg (US)

Civic Hybrid - '12 Honda Civic Hybrid
Team Honda

Bahamut - '18 Chevrolet Volt LT
Team Volt
Plug-in Hybrids
Thanks: 6
Thanked 48 Times in 23 Posts
Approximate Vacuum readings on Magenta Optimum Efficiency Line:

6.7"hg at 1000 rpm

6.5"hg at 1500 rpm

5.7"hg at 2000 rpm

5.0"hg at 2500 rpm

3.8"hg at 3000 rpm

2.3"hg at 3500 rpm

1.3"hg at 4000 rpm

0.9"hg at 4500 rpm

0.2"hg at 5000 rpm

WOT at >5100 rpm
__________________

: Brothers
: Dad's
  Reply With Quote
Old 08-20-2014, 12:21 AM   #249 (permalink)
EcoModding Lurker
 
AdrianD's Avatar
 
Join Date: Apr 2012
Location: Overseas
Posts: 78
Thanks: 9
Thanked 37 Times in 29 Posts
BSFC chart for a 2.5 Turbo Diesel Jeep Cherokee (VM Motori engine)

  Reply With Quote
Old 09-04-2014, 08:03 PM   #250 (permalink)
EcoModding Apprentice
 
ERTW's Avatar
 
Join Date: Jan 2012
Location: Toronto
Posts: 130

Bu - '08 Chevrolet Malibu LS
90 day: 32.29 mpg (US)
Thanks: 52
Thanked 73 Times in 36 Posts
I just read that the 2014 Stingray gets 330 g/kWh in V8 mode, 275 g/kWh in V4 mode.

__________________
“Soft shapes follow us through life. Nature does not make angles. Hips and bellies and breasts — all the best designers have to do with erotic shapes and fluidity of form.” - Luigi Colani
  Reply With Quote
Reply  Post New Thread


Powered by vBulletin® Version 3.8.11
Copyright ©2000 - 2024, vBulletin Solutions Inc.
Content Relevant URLs by vBSEO 3.5.2
All content copyright EcoModder.com