08-01-2017, 01:13 PM
|
#1 (permalink)
|
|
Human Environmentalist
Join Date: Aug 2010
Location: Oregon
Posts: 13,018
Thanks: 4,375
Thanked 4,553 Times in 3,500 Posts
|
Speed vs Efficiency with respect to total travel time
Posted on the Chevy Bolt forum, but I'm posting here too since this is such an intelligent forum.
Lets imagine a 1000 mile road trip on an interstate that had no speed limit. In a gasoline powered car, you will always arrive at your destination sooner the faster you drive. You'll have to stop for fuel more frequently if you drive faster, but considering how quick it is to refuel, there is no practical limit to your speed with respect to arriving at the destination sooner.
Now consider the same trip in the Bolt. It takes longer to recharge, and the closer to full the battery becomes, the slower the charge rate. Driving 100 MPH on this trip likely wouldn't get you to the destination quicker than driving 65 MPH considering the extra stops needed to recharge.
Has anyone done the math to determine the optimal speed vs efficiency to arrive at a long distance destination the quickest? What does that formula look like, especially given the non-linear charging characteristics?
This graph is what got me thinking about the topic:
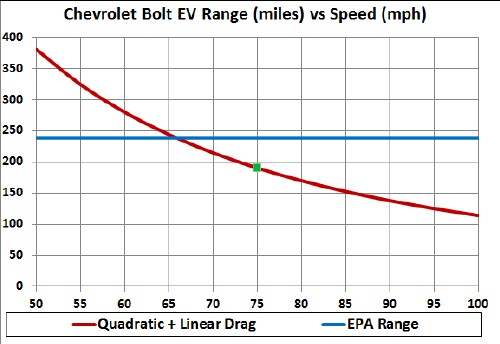
Some very rough estimates based on this graph show that traveling at 70 MPH will require 5 full charges (1000 mi distance / 200 miles per charge). At 100 MPH, you would need 10 full charges (1000 mi distance / 100 miles per charge). At 70 MPH, it would take 14hrs 17min of driving to cover 1000 miles. At 100 MPH, it would take 10hrs, for a difference of 4hrs 17min.
It would certainly take more than 4hrs 17min to get 5 more full charges, so clearly traveling at 100 MPH on a long road trip wouldn't get you to the destination quicker than traveling at 70 MPH.
What is the optimal speed given this scenario?
To complicate the question, should the vehicle be charged to full each time, or is it more time efficient to only charge to a certain percentage, and make more frequent charging stops?
|
|
|

|
 Today Today
|
|
|
|
 Other popular topics in this forum...
|
|
|
|
|
08-01-2017, 01:40 PM
|
#2 (permalink)
|
|
Human Environmentalist
Join Date: Aug 2010
Location: Oregon
Posts: 13,018
Thanks: 4,375
Thanked 4,553 Times in 3,500 Posts
|
MODS- Perhaps this is thread is more appropriate in the General Efficiency forum.
|
|
|
|
|
08-01-2017, 02:58 PM
|
#3 (permalink)
|
|
Master EcoModder
Join Date: Feb 2011
Location: Phillips, WI
Posts: 1,019
Thanks: 192
Thanked 467 Times in 287 Posts
|
This problem does not have a closed form solution. You need to calculate the number of stops for a range of speeds, then the driving time for each speed, and add in the recharge time.
Let's start simple, then decide if we want more detail later. Assume start with 100% charge, on the road quick charges to 80%, and stop for recharge at 10%. That gives 90% range with the initial charge, and 70% range with on the road charges. Now calculate range vs speed, and number of stops for these numbers:
Speed 90%range 70%range Number stops
50 ... 335 ... 260 ... 3
54 ... 297 ... 231 ... 3
55 ... 290 ... 225 ... 4
60 ... 250 ... 195 ... 4
100 ... 103 ... 80 ... 12
Figure 45 minutes for each recharge.
Speed DrvTim ChrgTim Total Time
50 ... 20.0 ... 2.25 ... 22.25 hours
54 ... 18.5 ... 2.25 ... 20.8
55 ... 18.2 ... 3.00 ... 21.2
60 ... 16.7 ... 3.00 ... 19.7
100 ... 10.0 ... 9.00 ... 19.0
Somebody else can fill in the numbers for speeds between 60 MPH and 100 MPH. The optimal speeds are those which get to the destination with only 10% charge left. Go slightly faster, and you gain minimal driving time, but need one more charge. So 54 MPH is the best speed for three recharges on the road because going 1 MPH faster requires one more recharge.
__________________
06 Canyon: The vacuum gauge plus wheel covers helped increase summer 2015 mileage to 38.5 MPG, while summer 2016 mileage was 38.6 MPG without the wheel covers. Drove 33,021 miles 2016-2018 at 35.00 MPG.
22 Maverick: Summer 2022 burned 62.74 gallons in 3145.1 miles for 50.1 MPG. Winter 2023-2024 - 2416.7 miles, 58.66 gallons for 41 MPG.
|
|
|
|
|
The Following User Says Thank You to JRMichler For This Useful Post:
|
|
|
08-01-2017, 04:01 PM
|
#4 (permalink)
|
|
Human Environmentalist
Join Date: Aug 2010
Location: Oregon
Posts: 13,018
Thanks: 4,375
Thanked 4,553 Times in 3,500 Posts
|
Very good analysis JR. If we calculate a few points, we can draw a curve along those points to get a reasonably accurate graph.
The rate of charging in your examples are over optimistic for the Bolt (perhaps accurate for some Teslas?).
Here are some excerpts from what I've read concerning CSS DCFC for the Bolt:
Quote:
To get CLOSE to 90 miles in 30 minutes (based off the 238 mile EPA range), you will need to charge from a 125 amp DCFC.
The most I've ever seen is 22.27 kWh in a 30 minute session. As even DCFC'ing is not 100% efficient (probably a 5% loss or so), that 22.27 kWh from the station is probably more like 21.2 kWh into the actual battery.
21.2 kWh / 60 usable = 35.33% of the usable battery. 35.33% of 238 EPA miles = 84 EPA miles in 30 minutes.
|
Quote:
SOC was 33% according to the station when I started charging. Immediately got a 38 kW/100 amp charging rate right after plugging in. It climbed up to around 45 kW/125A over the next 5-7 minutes. Saw a peak rate of 46 kW according to the car during the session.
When SOC hit 53-54%, the Bolt ramped down to 100 amps and a 37-38 kW charge rate, where it stayed till the end of the 30 minute session.
So 33-66% SOC in 30 minutes. 20 kWh in 30 min for a total of $3 (10 cents x 30 min), or 17 cents/kWh.
I plugged in again for the heck of it, and charge rate went right to 38 kW. Stayed there till it hit 70% SOC, when it ramped down to 23/24 kW and 60-61 amps. Stayed there through 81% SOC, when I finally pulled the plug after 20 more minutes. Charged 9 more kWh.
|
Ideally, we would pull off to charge exactly when the EV hit 0% remaining capacity. Getting as close to that as possible while leaving a buffer makes sense, so 10% (approx 24 mile range) is reasonable.
Since the best we can hope for in the Bolt is 40 kW/hour, that puts us at about a 75% charge in 1 hour. Minus the 10% buffer, we have 65% of usable range per charge for an hour of charging.
That drastically changes things, increasing the time spent charging, increasing the number of charging sessions, and decreasing the range per charge.
Also, shouldn't the MPH vs Range curve be the inverse of what's shown?
Range should drop off at an increasing rate with speed, not a decreasing rate.
Assuming 40kWh per hour and 65% usable range for a 1hr charge (charging from 10% to 75% in 1hr), I plugged the numbers into Excel.
At 50 MPH, travel time is 20hrs and charge time is 3hrs for a total trip time of 23hrs.
At 71 MPH, travel time is 14.04hrs and charge time is 6hrs, for a total trip time of 20.04hrs.
At 95 MPH, travel time is 10.53hrs and charge time is 11 for a total trip time of 21.53hrs.
Based on the best assumptions I have, it looks like the most time efficient speed for a 1000 mile trip is about 70 MPH.
Interestingly, when I change the trip length to 500 miles, or 3000 miles, 75 MPH is close to the most time efficient speed.
Finally, one major problem with the formula is that it assumes you will spend an entire 1 hr to recharge even if you are just 1 mile shy of your destination when you reach 10% remaining battery capacity. In reality, if you hit 10% remaining and only have 15 miles to reach your destination, you'll likely keep going and skip that final hour of charging. Even if you can't quite make the final distance, you will only spend as much time charging as needed to get to the destination, assuming you can charge once the trip is completed.
Last edited by redpoint5; 08-01-2017 at 05:14 PM..
|
|
|
|
|
08-01-2017, 04:45 PM
|
#5 (permalink)
|
|
Banned
Join Date: Oct 2009
Location: Fort Worth, Texas
Posts: 2,442
Thanks: 1,422
Thanked 737 Times in 557 Posts
|
Before you boys get too carried away by these numbers, you'll have to include average mph as a factor.
As an example: last year I ran east from Fort Worth two days in a row on IH20. Set speed was 68-mph for cruise control. Both days were within a few miles and a few minutes of each other. Not planned. Average speed each day was 54-mph. Engine was never run when stopped.
Traffic, construction, etc.
There's always a divergence.
Had I set my speed at 62-mph I doubt there'd have a difference in travel time from the above worth calculating.
Hypothetical is great. Work this and other factors in.
Note: average speed will be higher between midnight and noon than the reverse.
|
|
|
|
|
The Following User Says Thank You to slowmover For This Useful Post:
|
|
|
08-01-2017, 04:50 PM
|
#6 (permalink)
|
|
Karmann Eclectric
Join Date: Feb 2010
Location: Graham, WA
Posts: 165
Thanks: 9
Thanked 90 Times in 51 Posts
|
Excellent topic. A webpage widget on this would be a great tool for EV noobs. With the i-MiEV or a Gen1 LEAF on the West Coast Electric Highway portion of I-5, since the CHAdeMO stations are spaced every 35-40 miles, both cars do best if you drive it like you stole it, charge to 80%, and repeat. A Gen II LEAF is able to skip every other station if you drive with care, so that changes the calculus...
A couple of times I've passed a LEAF en route to the next DCFC, and tried not to gloat when they pulled in for a charge a few minutes behind me.... ")
__________________
2012 Mitsubishi i-MiEV, 112 MPGe
2000 Honda Odyssey
1987 F250 Diesel, 6.9L IDI, goes on anything greasy
1983 Grumman Kurbwatt, 170 kW "Gone Postal" twin
1983 Mazda RX-7 electric, 48 kW car show cruiser
1971 VW Karmann Ghia electric, 300 kW tire-smoker
1965 VW Karmann Ghia cabriolet, 1600cc
Have driven over 100,000 all-electric miles!
|
|
|
|
|
The Following User Says Thank You to jray3 For This Useful Post:
|
|
|
08-01-2017, 04:58 PM
|
#7 (permalink)
|
|
Master EcoModder
Join Date: Feb 2011
Location: Phillips, WI
Posts: 1,019
Thanks: 192
Thanked 467 Times in 287 Posts
|
I was too lazy to properly research charge times and rates, so just pulled some numbers out of thin air to show the concept. Real numbers would include more variables - temperature, wind, terrain, battery condition, traffic, etc.
Trip time vs driving speed is a series of curves, with a step change every time the number of recharges changes. Sometimes driving a little faster will increase trip time (55 vs 54 MPH). Calculating a few more cases between 60 MPH and 100 MPH will find a speed that gives the minimum possible trip time.
It's interesting how trip time stops improving when the number of recharges increases. Now, try to explain to the passengers that you are driving at the speed that gets you there as fast as possible while they are watching traffic fly by in the fast lane......
__________________
06 Canyon: The vacuum gauge plus wheel covers helped increase summer 2015 mileage to 38.5 MPG, while summer 2016 mileage was 38.6 MPG without the wheel covers. Drove 33,021 miles 2016-2018 at 35.00 MPG.
22 Maverick: Summer 2022 burned 62.74 gallons in 3145.1 miles for 50.1 MPG. Winter 2023-2024 - 2416.7 miles, 58.66 gallons for 41 MPG.
|
|
|
|
|
The Following 2 Users Say Thank You to JRMichler For This Useful Post:
|
|
|
08-01-2017, 06:21 PM
|
#8 (permalink)
|
|
Karmann Eclectric
Join Date: Feb 2010
Location: Graham, WA
Posts: 165
Thanks: 9
Thanked 90 Times in 51 Posts
|
For most of us, the locations of DCFC stations (that are functioning) will be the greatest variable, and one that can change with each trip. This makes every trip segment unique, such that you might drive 75 mph on one segment and 55 mph on the next. The academic example of doing a journey in 5 charges vs 3 charges may only apply to Tesla owners. The rest of us have to figure the optimum speed between each of the only 4 chargers that are available.
__________________
2012 Mitsubishi i-MiEV, 112 MPGe
2000 Honda Odyssey
1987 F250 Diesel, 6.9L IDI, goes on anything greasy
1983 Grumman Kurbwatt, 170 kW "Gone Postal" twin
1983 Mazda RX-7 electric, 48 kW car show cruiser
1971 VW Karmann Ghia electric, 300 kW tire-smoker
1965 VW Karmann Ghia cabriolet, 1600cc
Have driven over 100,000 all-electric miles!
|
|
|
|
|
The Following User Says Thank You to jray3 For This Useful Post:
|
|
|
08-01-2017, 07:06 PM
|
#9 (permalink)
|
|
Human Environmentalist
Join Date: Aug 2010
Location: Oregon
Posts: 13,018
Thanks: 4,375
Thanked 4,553 Times in 3,500 Posts
|
True, the theoretical example above assumes that DCFC are as commonplace as petrol stations.
In practice, it's probably fastest to travel as quickly as possible to reach the next DCFC on the route, or perhaps skip some closely spaced chargers.
Maybe I'm overthinking this. Perhaps there is a threshold where the decreased efficiency of increasing speed is less time efficient given a linear (for ease of calculation) charging rate.
Anyhow, I like attempting to solve complex problems using Excel modeling. I've even used Excel to decide if I should take a job offer over keeping my current job.
|
|
|
|
|
08-01-2017, 09:43 PM
|
#10 (permalink)
|
|
Banned
Join Date: Oct 2009
Location: Fort Worth, Texas
Posts: 2,442
Thanks: 1,422
Thanked 737 Times in 557 Posts
|
Quote:
Originally Posted by jrmichler

i was too lazy to properly research charge times and rates, so just pulled some numbers out of thin air to show the concept. Real numbers would include more variables - temperature, wind, terrain, battery condition, traffic, etc.
Trip time vs driving speed is a series of curves, with a step change every time the number of recharges changes. Sometimes driving a little faster will increase trip time (55 vs 54 mph). Calculating a few more cases between 60 mph and 100 mph will find a speed that gives the minimum possible trip time.
It's interesting how trip time stops improving when the number of recharges increases. Now, try to explain to the passengers that you are driving at the speed that gets you there as fast as possible while they are watching traffic fly by in the fast lane......
|
That was funny as hell, Michler, thanks!
I see the thing as being able to predict total travel time accurately.
Plenty of factors, sure, but barring a fatal accident highway closure, Point A to Point B shouldn't ever take longer than . . . .
.
|
|
|
|
|