04-07-2021, 04:46 PM
|
#21 (permalink)
|
|
Banned
Join Date: Nov 2017
Location: Australia
Posts: 2,060
Thanks: 107
Thanked 1,608 Times in 1,137 Posts
|
Quote:
Originally Posted by Isaac Zachary

If someone is happy with their measuring... Good!
Usually whatever you don't won't make someone else happy anyway, si as long as you're happy.
|
No. Because the information is being posted here. And you just watch, people will take the measurements as being valid, and then in a few years it will become gospel.
That's exactly how so much misinformation has been promulgated here over so long.
I don't care what Vekke believes; I care that he is misleading people.
(Well, until he can demonstrate the efficacy of his measurement technique, I strongly suspect he is misleading people.)
|
|
|

|
 Today Today
|
|
|
|
 Other popular topics in this forum...
|
|
|
|
|
04-07-2021, 07:32 PM
|
#22 (permalink)
|
|
High Altitude Hybrid
Join Date: Dec 2020
Location: Gunnison, CO
Posts: 2,128
Thanks: 1,170
Thanked 609 Times in 479 Posts
|
Quote:
Originally Posted by JulianEdgar
No. Because the information is being posted here. And you just watch, people will take the measurements as being valid, and then in a few years it will become gospel.
That's exactly how so much misinformation has been promulgated here over so long.
I don't care what Vekke believes; I care that he is misleading people.
(Well, until he can demonstrate the efficacy of his measurement technique, I strongly suspect he is misleading people.)
|
Well it is a forum, not a university. And if it's obvious people are getting their numbers from seat-o-pants meters and not a laboratory test then I think we can all take it for what it's worth.
__________________

|
|
|
|
|
The Following 2 Users Say Thank You to Isaac Zachary For This Useful Post:
|
|
|
04-07-2021, 08:58 PM
|
#23 (permalink)
|
|
Banned
Join Date: Nov 2017
Location: Australia
Posts: 2,060
Thanks: 107
Thanked 1,608 Times in 1,137 Posts
|
Quote:
Originally Posted by Isaac Zachary
Well it is a forum, not a university. And if it's obvious people are getting their numbers from seat-o-pants meters and not a laboratory test then I think we can all take it for what it's worth.
|
Hes quoting data to multiple decimal places. History shows that many here will believe it, then quote it, then people coming down the track will adopt it. Plenty of examples here where that sort of thing has happened again and again. |
|
|
|
|
04-08-2021, 04:39 AM
|
#24 (permalink)
|
|
Mechanical engineer
Join Date: Jan 2009
Location: Kitee (Finland)
Posts: 1,277
Thanks: 273
Thanked 846 Times in 418 Posts
|
I will add disclaimer to first post so people don`t try to same mods to save energy.
Depending what you believe is the measuring accuracy of this test method at the moment savings are 4-6% or even lower if you are thinking results are not even 2% reliable. I published the rough data to show and everyone can make their assumtions on the test and its reliability. I was first very skeptical on first day results as I have believed more pressure will always give better energy consumption. Thats the reason why I publish any test results on the topic.
I made a video which shows the last results A run for the third time "same".
https://youtu.be/BqGumJCHb-8
If I would have had more time more tests would have been done. I had 5 days to work and test with the car and now I am back to Germany and car is still in Finland. During those 5 days I had about 15 hours to test the mods and about 12 hours to build mods. I am sure someone with more skills could do better... |
|
|
|
|
04-08-2021, 04:57 AM
|
#25 (permalink)
|
|
Banned
Join Date: Nov 2017
Location: Australia
Posts: 2,060
Thanks: 107
Thanked 1,608 Times in 1,137 Posts
|
OK, if I am reading your data correctly, you have a large variation in readings in the one configuration - like, 12 - 13 per cent variation. That doesn't surprise me from on-road energy consumption testing over a hilly course, but to then calculate averages (and only from a couple of data points) and claim improvements down to decimal places (eg 1.4 per cent) seems a bit optimistic.
I did an analysis of some of your data and I think that, for example, 2 Bar (not 2.5 Bar) tyre pressures gives better results than higher or lower pressures. At minimum you need to use all the data (not just average a couple of the measurements for each configuration).
If I were doing the testing, I think I'd consider variations between your averaged data sets significant only if the difference was ~5 per cent or greater.
Do you have a high resolution, instant power readout, real time? If so, holding one power value and then accurately measuring changes in speed with different tyre pressures may be more accurate. In ICE cars it's certainly much more repeatable than what you have shown here (I get less than 1 per cent variation in consecutive runs).
I've been testing on the road for more than 35 years. If, with the car in an identical configuration, any test technique gives a variation of 12-13 per cent on consecutive runs, then to me it is a highly untrustworthy technique.
For example, my throttle stop testing technique, if done appropriately, gives a maximum variation of 1-2 per cent in consecutive runs - ten times less data spread than you are seeing!
15 years ago when I was testing my Prius and Insight, the on-road fuel consumption data scatter over the course, with the car unchanged, was about 3 per cent.
I think it's great doing the testing, but I think you have to be far more realistic about what you are seeing. For example, I doubt any of your aero mods make any measurable difference on the road - the change in Cd would be far too small to measure in the way you suggest.
|
|
|
|
|
04-08-2021, 05:23 AM
|
#26 (permalink)
|
|
Banned
Join Date: Nov 2017
Location: Australia
Posts: 2,060
Thanks: 107
Thanked 1,608 Times in 1,137 Posts
|
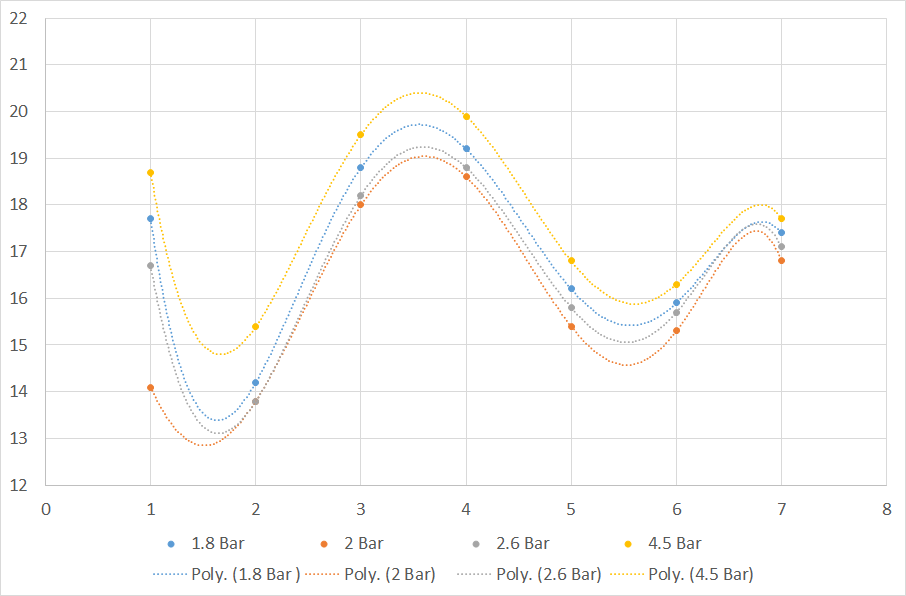
Here's another way of looking at some of your data. A scatter graph with some lines of best fit (5th order polynomials) drawn in.
1. If the measured data were consistent, the lines would be straight left /right.
2. If the measured difference between configurations was consistent, the gap between the lines would be equal.
Obviously neither of these in the case.
However, it can be seen that generally the 2 Bar pressures give lower energy consumption than the other pressures I've graphed.
This is just a subset of the data (Direction A for just these pressures) but this is the sort of analysis I suggest you do for all the data you have collected. It would be interesting to see the results presented in this way for your aerodynamic modifications.
|
|
|
|
|
The Following User Says Thank You to JulianEdgar For This Useful Post:
|
|
|
04-08-2021, 05:50 AM
|
#27 (permalink)
|
|
Mechanical engineer
Join Date: Jan 2009
Location: Kitee (Finland)
Posts: 1,277
Thanks: 273
Thanked 846 Times in 418 Posts
|
See the video and you will see the route. Its not level at all and measuring points are on the highs and lows of the route. So points during tests cannot give straight line results.
Points follow each other nicely from start to finish, meaning they dont change places (they move little but not much).
you always need to sum the A + B results for each run to get the wind effect. On diesel car testing there were huge differences how well car perfomed to more uphill or downhill direction. Thats why I dont test anymore in level roads as it gives you just how well it performs on that level road. The cars ecu program needs to perform well in all driving conditions.
When the values change you will get more resolution to your results. Same like putting your fans and ligths on for the same route. I have done that with diesel cars to get more resolution in some tests.
If there is wind (tuulta) 15km/h tailwind will give you little bit better results to wind direction the 2,0 bar measurement as real speed is 85 km/h (about 11.9 kwh on level road), but on the other direction speed is 115km/h which gives much higher consumption (about 21,0kwh )increase than the other direction has given lower. So overall is higher.
Its true more measurements should be done and I usually do them after more mods have been done to see if car behaves better. Also I learn all the time how this car behaves so I can estimate things better what effects what like the outside temp changes.
Last edited by Vekke; 04-08-2021 at 06:00 AM..
|
|
|
|
|
04-08-2021, 06:03 AM
|
#28 (permalink)
|
|
Banned
Join Date: Nov 2017
Location: Australia
Posts: 2,060
Thanks: 107
Thanked 1,608 Times in 1,137 Posts
|
Oh well, I tried.
|
|
|
|
|
04-08-2021, 06:50 AM
|
#29 (permalink)
|
|
Long time lurker
Join Date: May 2019
Location: Uk
Posts: 218
Thanks: 110
Thanked 153 Times in 119 Posts
|
If the margin of error is greater than the difference between control results and test results you cannot draw any conclusions other than better testing is necessary to get statistically significant results.
|
|
|
|
|
04-08-2021, 04:18 PM
|
#30 (permalink)
|
|
Banned
Join Date: Nov 2017
Location: Australia
Posts: 2,060
Thanks: 107
Thanked 1,608 Times in 1,137 Posts
|
Quote:
Originally Posted by AeroMcAeroFace
If the margin of error is greater than the difference between control results and test results you cannot draw any conclusions other than better testing is necessary to get statistically significant results.
|
Yes, that's a better way of putting it than my explanations.
Measure a baseline, ensure that baseline is repeatable, then start doing some testing, realising that if the test results have less variation from the baseline than the variation in the baseline itself, the results cannot be trusted.
Also, if I have the measurements understood correctly, all the interim measurements (are they instantaneous values?) are largely pointless. Instead, do the average energy consumption over an entire course (I assume the car can calculate that?). That's what we did with a Tesla Model 3 over a 12km loop, windows up and then windows down.
|
|
|
|
|