Go Back   EcoModder Forum > EcoModding > Instrumentation
Register Now
 Register Now
 

Reply  Post New Thread
 
Submit Tools LinkBack Thread Tools
Old 04-26-2009, 03:48 AM   #1 (permalink)
NightKnight
 
NachtRitter's Avatar
 
Join Date: Dec 2008
Location: Placerville, CA
Posts: 1,594

RippinRoo - '05 Subaru Legacy Wagon 2.5 GT
Subaru
90 day: 21.16 mpg (US)

Helga - '00 Volkswagen Jetta TDI
TEAM VW AUDI Group
Diesel
90 day: 53.91 mpg (US)

Olga - '03 Volkswagen Jetta Wagon
90 day: 46.24 mpg (US)
Thanks: 303
Thanked 311 Times in 186 Posts
Awesome free SW for tracking your efforts

Hey folks,

If you're like me, you like to track your miles down to the minutiae. Some of you may use good ol' pen & paper, some use spreadsheets, tracking your miles, notes on what things you might have done differently (Pulse to 65, glide to 55 on this trip, 75 to 60 on that trip, etc), and your FE as a result. All with the goal of improving your FE by figuring out what works and what doesn't.

I think the GPS has become one of the more valuable tools in that regard. The little Garmin nuvi 260 I recently purchased has a feature which captures "tracks", a collection of coordinates showing where I have gone with it; this is a feature which I believe nearly every GPS has nowadays. When I was researching how best to extract those tracks for the purpose of logging the details of my commute, I stumbled upon logbook software which I think would be very useful for any dedicated hypermiler that happens to have a Windows PC (or a way to run Windows software).

The software is called SportTracks, available free to try at SportTracks. It is intended for logging exercise such as running or cycling, but I've found it works beautifully for logging all my driving too.

The software allows me to set up different categories and sub-categories for my imported tracks (I like to separate out errands vs commuting; I could imagine someone using their car for business could set up a categories for that as well).

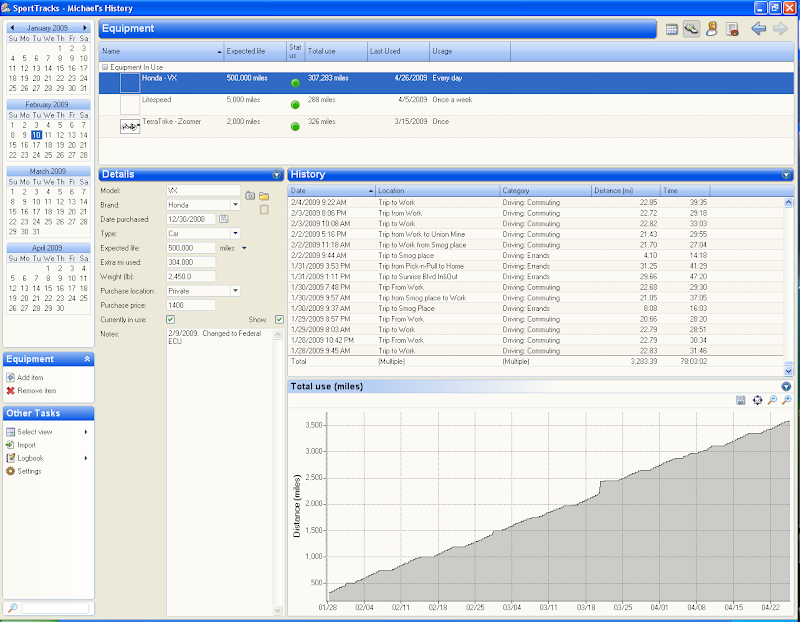
I can also set up various vehicles that a track could be applied to. Basically I can take the GPS with me into any car or when I go bike riding and I would be able to apply each GPS track to the corresponding vehicle. Below is the "Equipment" view where I can capture details about each vehicle and where I can see the history of the miles (or kilometers, if so set) driven.


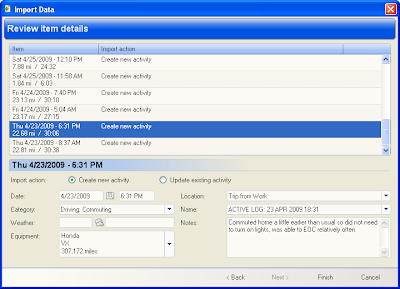
It will import a Garmin .gpx file (which is the xml formatted file created by the GPS), compare against the tracks it already knows about, and automatically select for import those that are new. It then allows me to add additional details about the track, such as track category, vehicle, weather, location, and notes. Below is the "import" view, where I'm importing the last few days worth of GPS data all at once.


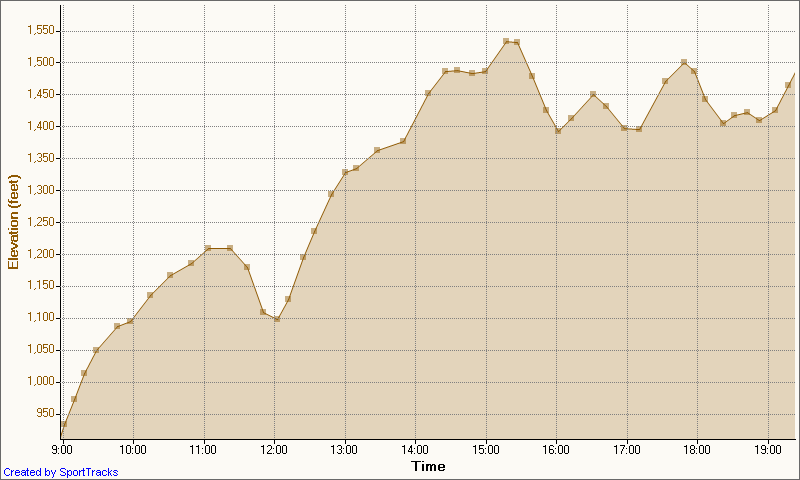
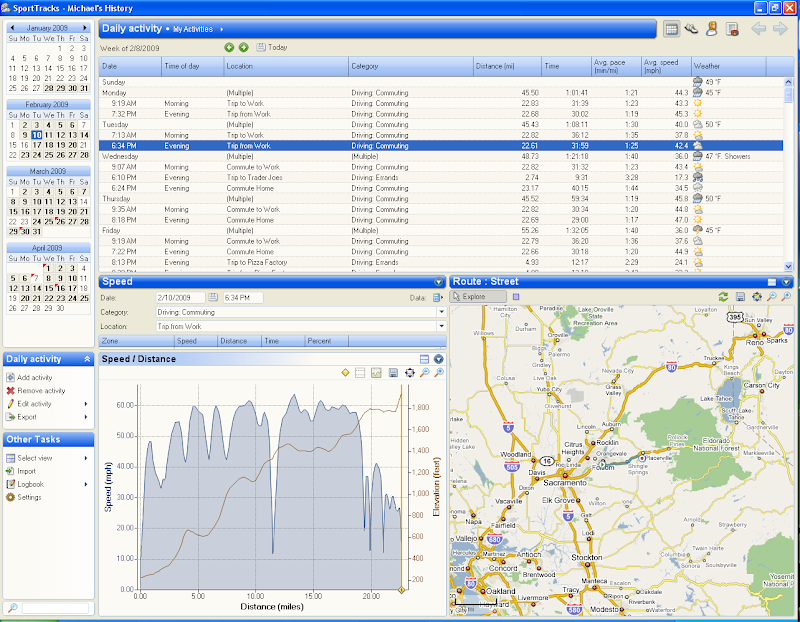
Once imported, the software shows the track on a map and allows me to select a variety of graph views to show things like speed, altitude, grade, etc. Of course, many of the things it offers are related to cycling or running, but I can ignore those. I can then select any point on the graph and the corresponding point on track shown on the map is highlighted, or vice versa. The view below is my favorite; I've combined both speed and altitude on one graph, and the track map is next to that. I can zoom in as close as I want on the map, and can show street view, satellite view, topo view, etc. The data table layout, the graph layout, and the map layout are all very configurable.


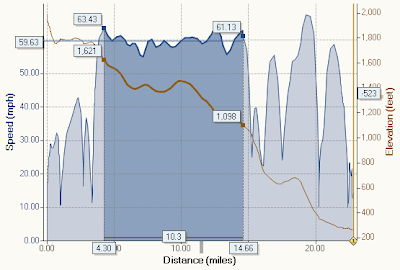
Another nice feature is the ability to select a subset of the graph, and it'll show the various begin / end points and appropriate summary information... in this case, average speed, altitude difference, and distance traveled. The corresponding track points are highlighted on the map as well (not shown in the image below).


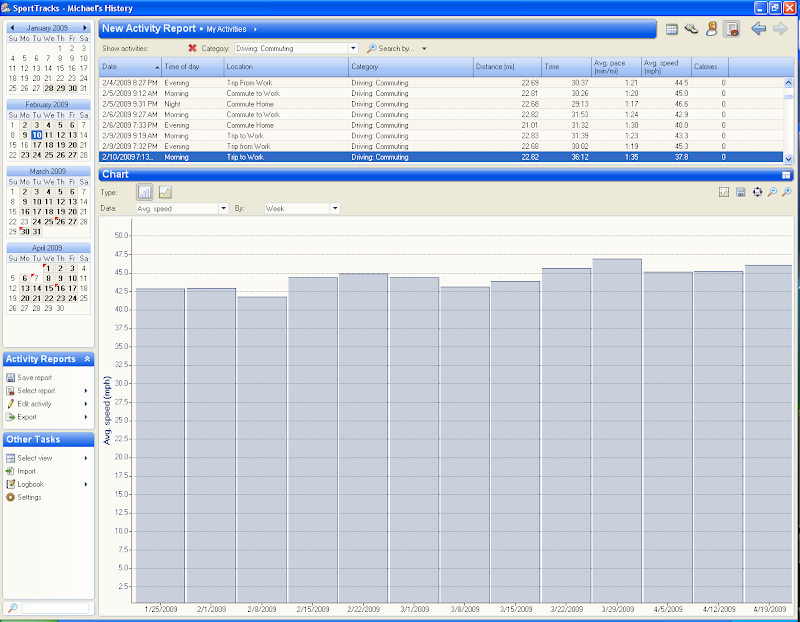
There are also some nice reporting utilities built-in, allowing me to easily and quickly see trends over time. Here is my average speed per week for the commuting category.


Any window showing a graphic or data can be right-clicked and copied... the graphics will be copied as an image that can be pasted into a variety of other Windows programs, and the data can be pasted into a spreadsheet for further analysis.

The imported tracks along all other information entered is saved into a logbook file format, which is also xml and therefore can be manipulated by other xml-aware tools and programming languages. It's very easy to share the logbook files with others using SportTracks; it keeps a friend's data separate from your own so you can compare your data against theirs.

Overall, the software is really well thought out, IMHO. There are a few little quirks, but I've never seen anything better for being able to visualize my gps data.

The software also allows for "plugin" development, which extends the functionality. Seems like a plugin that is focused on FE would be ideal! If there were a way to take an MPGuino and modify it a little to include a GPS and have a way to capture all the data into an SD card, then it would end up being the perfect match for this software tool.


Last edited by NachtRitter; 04-26-2009 at 04:05 AM..
  Reply With Quote
Alt Today
Popular topics

Other popular topics in this forum...

   
Old 04-26-2009, 06:31 AM   #2 (permalink)
dcb
needs more cowbell
 
dcb's Avatar
 
Join Date: Feb 2008
Location: ˙
Posts: 5,038

pimp mobile - '81 suzuki gs 250 t
90 day: 96.29 mpg (US)

schnitzel - '01 Volkswagen Golf TDI
90 day: 53.56 mpg (US)
Thanks: 158
Thanked 269 Times in 212 Posts
Quote:
Originally Posted by NachtRitter View Post
It will import a Garmin .gpx file
Just to clarify, Garmin does not own the gpx file format. It is a standard format for use by any GPS device/company.
GPS eXchange Format - Wikipedia, the free encyclopedia
__________________
WINDMILLS DO NOT WORK THAT WAY!!!

Last edited by dcb; 04-26-2009 at 07:59 AM..
  Reply With Quote
Old 04-26-2009, 01:25 PM   #3 (permalink)
NightKnight
 
NachtRitter's Avatar
 
Join Date: Dec 2008
Location: Placerville, CA
Posts: 1,594

RippinRoo - '05 Subaru Legacy Wagon 2.5 GT
Subaru
90 day: 21.16 mpg (US)

Helga - '00 Volkswagen Jetta TDI
TEAM VW AUDI Group
Diesel
90 day: 53.91 mpg (US)

Olga - '03 Volkswagen Jetta Wagon
90 day: 46.24 mpg (US)
Thanks: 303
Thanked 311 Times in 186 Posts
Ah, good point... thanks for clarifying!
  Reply With Quote
Old 04-26-2009, 02:41 PM   #4 (permalink)
EcoModding Apprentice
 
PA32R's Avatar
 
Join Date: Apr 2008
Location: Anaheim, CA
Posts: 129

LR3 - '06 Land Rover LR3 HSE
90 day: 21.13 mpg (US)
Thanks: 1
Thanked 2 Times in 1 Post
Looks like cool software, and you've apparently been using it for a while. So my question is related to your opening paragraph: Has this helped you improve your fuel economy and, if so, how and by how much? This isn't a challenge, just an earnest request for information.

Rob
  Reply With Quote
Old 04-26-2009, 11:59 PM   #5 (permalink)
NightKnight
 
NachtRitter's Avatar
 
Join Date: Dec 2008
Location: Placerville, CA
Posts: 1,594

RippinRoo - '05 Subaru Legacy Wagon 2.5 GT
Subaru
90 day: 21.16 mpg (US)

Helga - '00 Volkswagen Jetta TDI
TEAM VW AUDI Group
Diesel
90 day: 53.91 mpg (US)

Olga - '03 Volkswagen Jetta Wagon
90 day: 46.24 mpg (US)
Thanks: 303
Thanked 311 Times in 186 Posts
Hi Rob,

No, I can't say that it has improved my FE at all yet. I'm missing a key piece of information currently, which is either my instantaneous FE matched to the track (that would be ideal) or the average for the track. To that end, I'm going to install a MPGuino which will at least give me the average for the trip. I was then planning to use the HR (heartrate) field for tracking the trip average mpg, so that I can try different approaches during my commute (DWL, P&G, EOC, etc) to see what works best for the vehicle I'm driving. I've gotten fairly consistent FE during my commute so far, but don't know if what I'm doing now is necessarily giving the best FE. Despite being consistent, I still think that trying to do tank to tank comparisons allows for too much variation with weather, traffic, etc.

Ideally, as I mentioned, would be to have a way to capture the instantaneous FE throughout the trip so that I could compare point by point: speed, grade (of the road), and FE... and maybe even other data like TPS, IAT, coolant temp, etc if there was a way to capture that. The graphing and reporting abilities of the software have the capability to reveal some valuable nuggets of knowledge.

Mainly I wanted to post about the software because I think it has a lot of potential just as-is if there are others that already use an MPGuino plus a GPS. And if there is enough interest, then potentially there could be a community effort to bring together different existing Arduino projects - MPGuino, which already has code to output the data via serial port; an Arduino GPS shield; and an Arduino SD card shield for capturing data. Some innovative coding could bring it all together (says the guy in the peanut gallery). That by itself would be valuable, and then adding the ability to import into SportTracks to map the FE against the GPS data would be awesome!
  Reply With Quote
Old 04-28-2009, 08:23 PM   #6 (permalink)
EcoModding Apprentice
 
PA32R's Avatar
 
Join Date: Apr 2008
Location: Anaheim, CA
Posts: 129

LR3 - '06 Land Rover LR3 HSE
90 day: 21.13 mpg (US)
Thanks: 1
Thanked 2 Times in 1 Post
Instantaneous FE attached to the track would be great. I could use it to determine optimal acceleration rates experimentally to confirm my mathematical model. It's one of the few hypermiling methods I've not been able to convincingly determine a way to optimize. And my FE numbers have topped out, having settled into a quasi-periodic wandering around 20.6 m.p.g. I'd sure like to know if I'm doing the best I can.

I agree that that would be an awesome package.

Last edited by PA32R; 04-29-2009 at 01:29 PM.. Reason: typo
  Reply With Quote
Old 04-30-2009, 03:53 PM   #7 (permalink)
NightKnight
 
NachtRitter's Avatar
 
Join Date: Dec 2008
Location: Placerville, CA
Posts: 1,594

RippinRoo - '05 Subaru Legacy Wagon 2.5 GT
Subaru
90 day: 21.16 mpg (US)

Helga - '00 Volkswagen Jetta TDI
TEAM VW AUDI Group
Diesel
90 day: 53.91 mpg (US)

Olga - '03 Volkswagen Jetta Wagon
90 day: 46.24 mpg (US)
Thanks: 303
Thanked 311 Times in 186 Posts
Looking at the software and thinking about this a bit last night... I realize that graphing instantaneous MPG is not going to work because of the times I EOC or even when I just let off the gas and go into DFCO mode... I'd end up with a divide by zero (or essentially infinite MPG). The graph would end up with super high spikes with some noise at the bottom (containing some of the more useful data).

I was thinking one solution would be to "cap" the spikes like they do on some displays that show 99.9MPG or something like that, but since the graph pulls the points from the data store, that would mean the data points themselves would have to be changed, and that would end up skewing the average mpg for the trip... so not necessarily a good solution.

So maybe the best solution would be to use the same approach as Europe (and other countries) use, and show the gallons used per 100 miles. So 50mpg would be 2 gallons per 100 miles. Then an EOC or DFCO portion would show 0 gallons per 100 miles, and lower usage would be (more or less) intuitively better.

Average for the trip (or "track") should probably still show as MPG, since that's what is familiar for those of us that use miles & gallons.

Obviously, the plugin would need to handle both US and metric measures, but the metric FE measure is already in the right form for graphing instantaneous data.
  Reply With Quote
Old 04-30-2009, 06:18 PM   #8 (permalink)
Master EcoModder
 
Join Date: Aug 2008
Location: South Dakota
Posts: 460

WonderWagon - '94 Ford Escort LX
Last 3: 51.52 mpg (US)

DaBluOne - '99 Ford Escort SE
90 day: 48.97 mpg (US)

DaRedOne - '99 Ford Escort ZX2 Hot
Thanks: 0
Thanked 15 Times in 4 Posts
Does the imported GPS data include elevation?

What is a typical GPS sampling rate?
__________________
  Reply With Quote
Old 04-30-2009, 06:38 PM   #9 (permalink)
NightKnight
 
NachtRitter's Avatar
 
Join Date: Dec 2008
Location: Placerville, CA
Posts: 1,594

RippinRoo - '05 Subaru Legacy Wagon 2.5 GT
Subaru
90 day: 21.16 mpg (US)

Helga - '00 Volkswagen Jetta TDI
TEAM VW AUDI Group
Diesel
90 day: 53.91 mpg (US)

Olga - '03 Volkswagen Jetta Wagon
90 day: 46.24 mpg (US)
Thanks: 303
Thanked 311 Times in 186 Posts
Yes, imported GPS data includes elevation. In the image capture below, you can see both the graph for my "instantaneous" speed and my elevation overlayed together. The brown line is elevation, the blue with blue fill is speed.


I'm not sure about the actual sampling rate; I'll have to check once I get back home.
  Reply With Quote
Old 05-01-2009, 03:54 PM   #10 (permalink)
NightKnight
 
NachtRitter's Avatar
 
Join Date: Dec 2008
Location: Placerville, CA
Posts: 1,594

RippinRoo - '05 Subaru Legacy Wagon 2.5 GT
Subaru
90 day: 21.16 mpg (US)

Helga - '00 Volkswagen Jetta TDI
TEAM VW AUDI Group
Diesel
90 day: 53.91 mpg (US)

Olga - '03 Volkswagen Jetta Wagon
90 day: 46.24 mpg (US)
Thanks: 303
Thanked 311 Times in 186 Posts
Here is a view that gives you an idea of the sampling rate. The bottom is time in minutes, and each square represents a data point.


Strangely uneven rate... it's as many 6x a minute and as little as 4x a minute. Probably related to speed, but not sure what the sampling algorithm is...

  Reply With Quote
Reply  Post New Thread


Similar Threads
Thread Thread Starter Forum Replies Last Post
free OBD2 software with MPG calc whitewiz Instrumentation 11 12-10-2014 10:53 AM
Win $100.00 in Free Gas! Design Contest: Ecomod my Ride XFi EcoModding Central 127 02-17-2011 12:07 AM


Powered by vBulletin® Version 3.8.11
Copyright ©2000 - 2024, vBulletin Solutions Inc.
Content Relevant URLs by vBSEO 3.5.2
All content copyright EcoModder.com