 02-05-2018, 02:08 AM
|
#921 (permalink)
|
|
Corporate imperialist
Join Date: Jul 2011
Location: NewMexico (USA)
Posts: 11,310
Thanks: 273
Thanked 3,579 Times in 2,842 Posts
|
Quote:
Originally Posted by NeilBlanchard

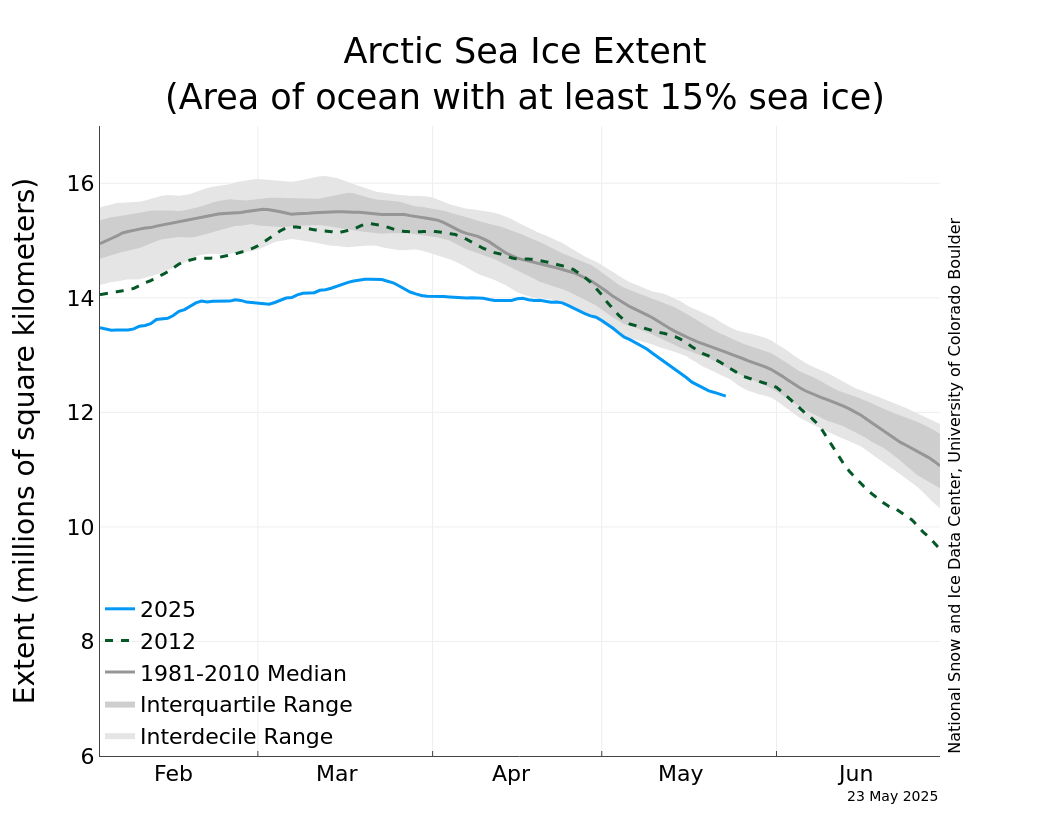
Here's the Arctic:

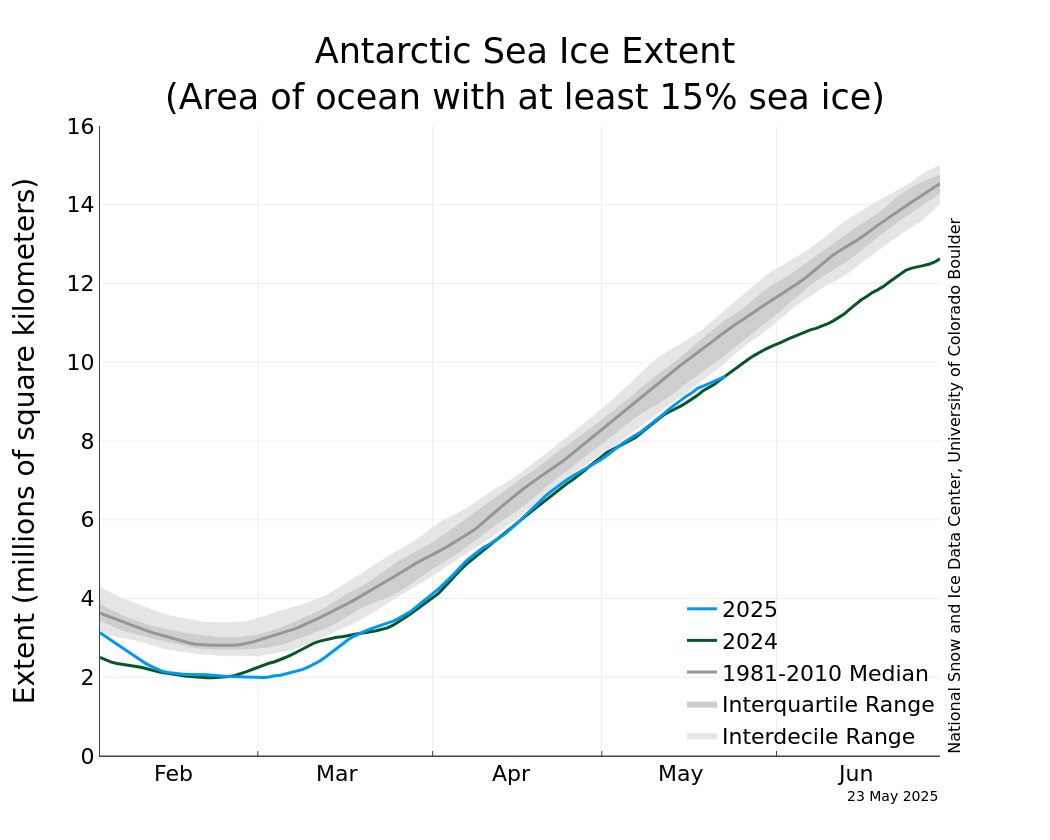
And the Antarctic:

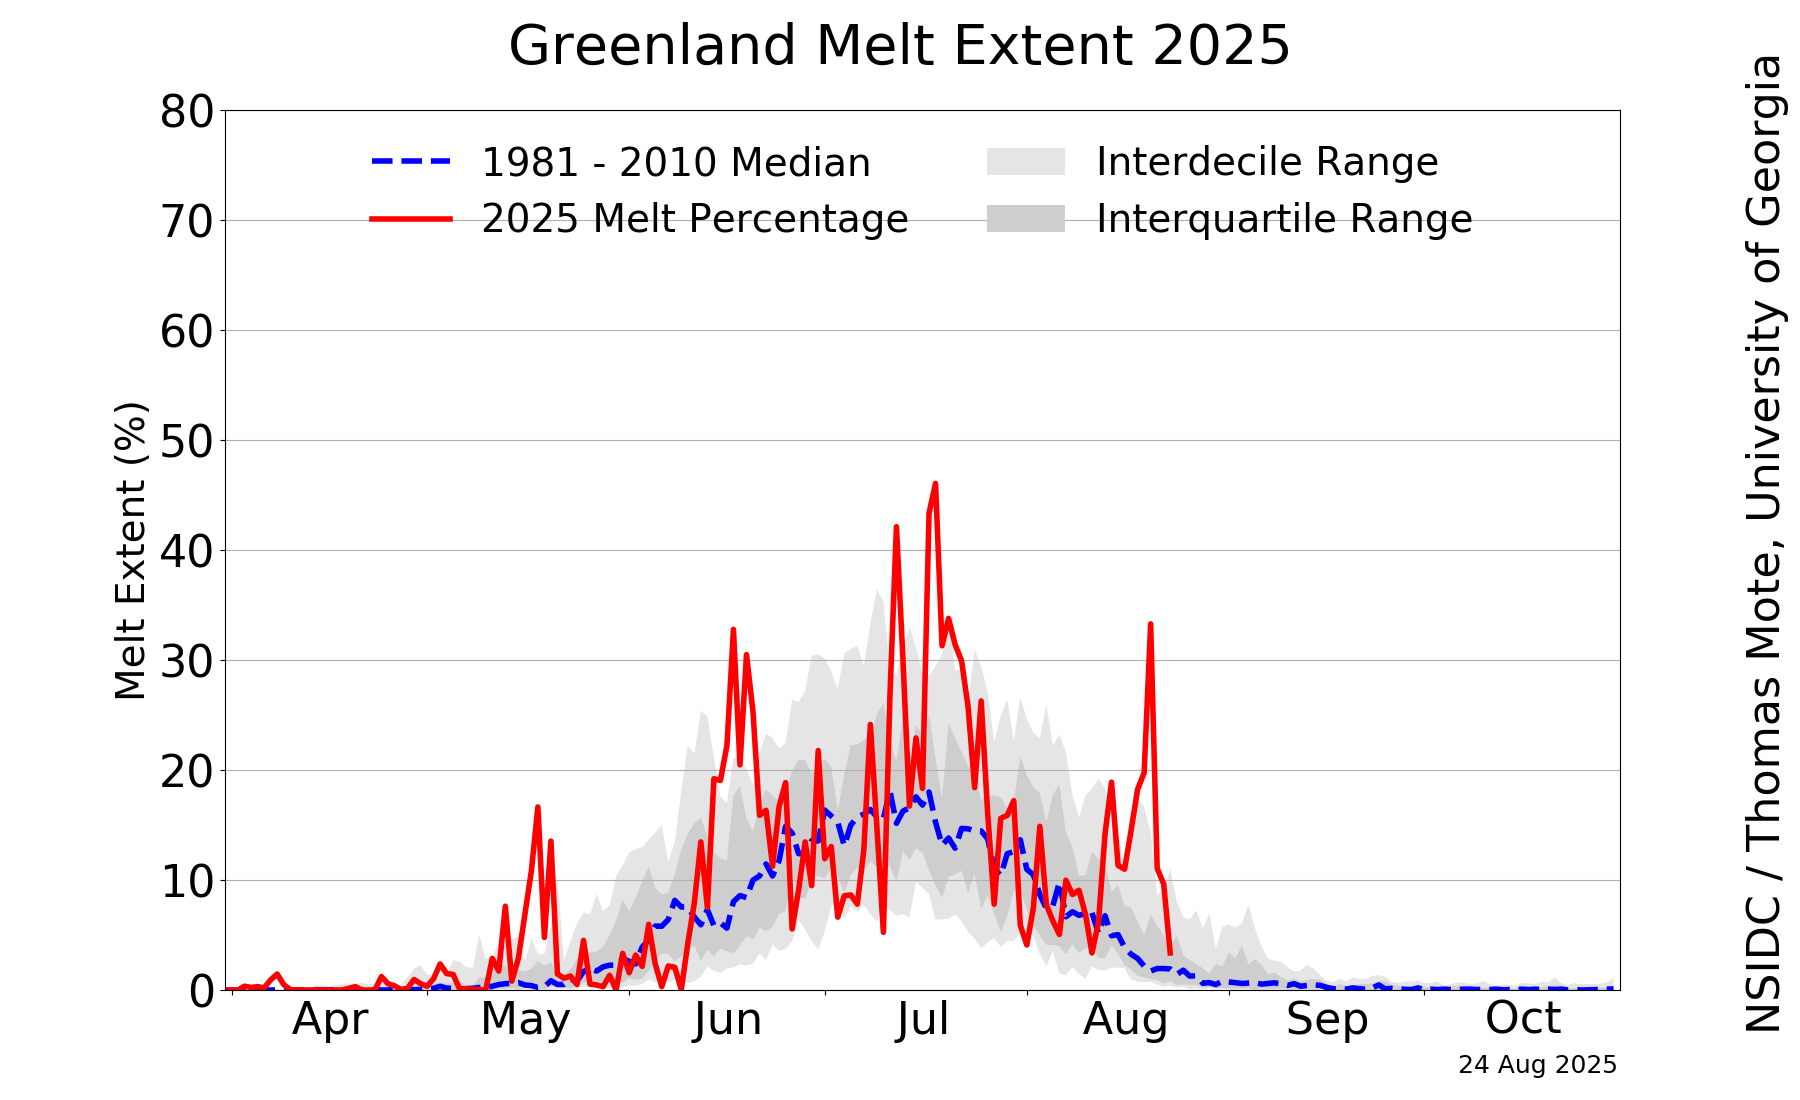
And here's Greenland:
 |
Challenge accepted.
First off sample size. For something as complex as the earth a 29 year sample size is a joke, further more comparing 29 year sample size to individual winters is text book definition cherry picking.
On top of that the same bunch of people who were telling us the polar ice caps were going to be melted by 2010 were convinced in the late 1970s the next ice age was here. So it would be reasonable to assume that the late 1970s and early 1980s were cooler than usual.
Plus in the mid 90s mount penitubo erupted, causing 2 years of 2°F cooler than normal temps.
I also noticed a few years were conveniently left out on those charts, I'm sure those years didn't matter at all. It just looks exactly like more cherry picking.
I should also add the 2017 greenland melt does not appear to be much of a statical anomaly, unless some one is going out of their way to make it look that way.
Bottom line, I want them to be right, looking forward to seeing a warmer world.
__________________
1984 chevy suburban, custom made 6.5L diesel turbocharged with a Garrett T76 and Holset HE351VE, 22:1 compression 13psi of intercooled boost.
1989 firebird mostly stock. Aside from the 6-speed manual trans, corvette gen 5 front brakes, 1LE drive shaft, 4th Gen disc brake fbody rear end.
2011 leaf SL, white, portable 240v CHAdeMO, trailer hitch, new batt as of 2014.
|
|
|
|
 Today Today
|
|
|
|
 Other popular topics in this forum...
|
|
|
|
 02-05-2018, 11:34 AM
|
#922 (permalink)
|
|
Master EcoModder
Join Date: May 2008
Location: Maynard, MA Eaarth
Posts: 7,908
Thanks: 3,475
Thanked 2,953 Times in 1,846 Posts
|
We have data for a much longer period, from other sources than satellites.

[click on image for link]
And the trend of all 37 years is downward.
Last edited by NeilBlanchard; 02-06-2018 at 01:23 PM..
|
|
|
|
 02-05-2018, 06:26 PM
|
#923 (permalink)
|
|
Corporate imperialist
Join Date: Jul 2011
Location: NewMexico (USA)
Posts: 11,310
Thanks: 273
Thanked 3,579 Times in 2,842 Posts
|
When numbers are cherry picked like this using invalid sample size there is great potential to get the trend to show whatever you want.
__________________
1984 chevy suburban, custom made 6.5L diesel turbocharged with a Garrett T76 and Holset HE351VE, 22:1 compression 13psi of intercooled boost.
1989 firebird mostly stock. Aside from the 6-speed manual trans, corvette gen 5 front brakes, 1LE drive shaft, 4th Gen disc brake fbody rear end.
2011 leaf SL, white, portable 240v CHAdeMO, trailer hitch, new batt as of 2014.
|
|
|
|
 02-05-2018, 09:09 PM
|
#924 (permalink)
|
|
Master EcoModder
Join Date: Aug 2012
Location: northwest of normal
Posts: 29,089
Thanks: 8,255
Thanked 9,020 Times in 7,453 Posts
|
We should be preparing for extreme heat, extreme cold, hard radiation and loss of oxygen in the atmosphere.
__________________
.
.Without freedom of speech we wouldn't know who all the idiots are. -- anonymous poster
____________________
.
.What the headline giveth, the last paragraph taketh away. -- Scott Ott
|
|
|
|
 02-06-2018, 06:59 AM
|
#925 (permalink)
|
|
Corporate imperialist
Join Date: Jul 2011
Location: NewMexico (USA)
Posts: 11,310
Thanks: 273
Thanked 3,579 Times in 2,842 Posts
|
So basically like living in new Mexico.
__________________
1984 chevy suburban, custom made 6.5L diesel turbocharged with a Garrett T76 and Holset HE351VE, 22:1 compression 13psi of intercooled boost.
1989 firebird mostly stock. Aside from the 6-speed manual trans, corvette gen 5 front brakes, 1LE drive shaft, 4th Gen disc brake fbody rear end.
2011 leaf SL, white, portable 240v CHAdeMO, trailer hitch, new batt as of 2014.
|
|
|
|
|
The Following User Says Thank You to oil pan 4 For This Useful Post:
|
|
 02-06-2018, 01:18 PM
|
#926 (permalink)
|
|
Master EcoModder
Join Date: May 2008
Location: Maynard, MA Eaarth
Posts: 7,908
Thanks: 3,475
Thanked 2,953 Times in 1,846 Posts
|
Quote:
Originally Posted by oil pan 4

When numbers are cherry picked like this using invalid sample size there is great potential to get the trend to show whatever you want.
|
What are you talking about? This is the data, and you can check it out. |
|
|
|
 02-06-2018, 01:28 PM
|
#927 (permalink)
|
|
Master EcoModder
Join Date: May 2008
Location: Maynard, MA Eaarth
Posts: 7,908
Thanks: 3,475
Thanked 2,953 Times in 1,846 Posts
|
Quote:
Originally Posted by freebeard

We should be preparing for extreme heat, extreme cold, hard radiation and loss of oxygen in the atmosphere.
|
Um, the magnetic poles have switched in the past, and we are still protected from the solar wind. Mars has lost most of its atmosphere, because it magnetosphere weakened, and the solar wind stripped it away.
We are fine in this regard. We know because of ... science. |
|
|
|
 02-06-2018, 02:51 PM
|
#928 (permalink)
|
|
Master EcoModder
Join Date: Aug 2012
Location: northwest of normal
Posts: 29,089
Thanks: 8,255
Thanked 9,020 Times in 7,453 Posts
|
Their not saying we'd lose all the oxygen, just the O2 over the poles. The stuff we were killing with hair spray.
During previous pole flips there was no vulnerable electromagnetic technology to go boom/whimper.
__________________
.
.Without freedom of speech we wouldn't know who all the idiots are. -- anonymous poster
____________________
.
.What the headline giveth, the last paragraph taketh away. -- Scott Ott
|
|
|
|
 02-06-2018, 06:54 PM
|
#929 (permalink)
|
|
Corporate imperialist
Join Date: Jul 2011
Location: NewMexico (USA)
Posts: 11,310
Thanks: 273
Thanked 3,579 Times in 2,842 Posts
|
With the artic sea ice one they use 1981-2010 as the "base line" compare the base line to 2011 and 2012 then 2016 and 2017, while leaving out 2013, 2014 and 2015.
Then same thing with the antarctic except they leave out 2011 through 2015.
Thats called Cherry picking.
Given the limited available data all years should be included in the base line, even the ones that don't support the predetermined outcome.
__________________
1984 chevy suburban, custom made 6.5L diesel turbocharged with a Garrett T76 and Holset HE351VE, 22:1 compression 13psi of intercooled boost.
1989 firebird mostly stock. Aside from the 6-speed manual trans, corvette gen 5 front brakes, 1LE drive shaft, 4th Gen disc brake fbody rear end.
2011 leaf SL, white, portable 240v CHAdeMO, trailer hitch, new batt as of 2014.
|
|
|
|
 02-07-2018, 04:43 AM
|
#930 (permalink)
|
|
Master EcoModder
Join Date: Aug 2010
Location: Philippines
Posts: 2,173
Thanks: 1,739
Thanked 589 Times in 401 Posts
|
Quote:
Originally Posted by oil pan 4

With the artic sea ice one they use 1981-2010 as the "base line" compare the base line to 2011 and 2012 then 2016 and 2017, while leaving out 2013, 2014 and 2015.
Then same thing with the antarctic except they leave out 2011 through 2015.
Thats called Cherry picking.
Given the limited available data all years should be included in the base line, even the ones that don't support the predetermined outcome.
|
It's for simplicity's sake.
It's easy enough to find graphs with the missing data if you want it. The trend is still the same.

|
|
|
|
|