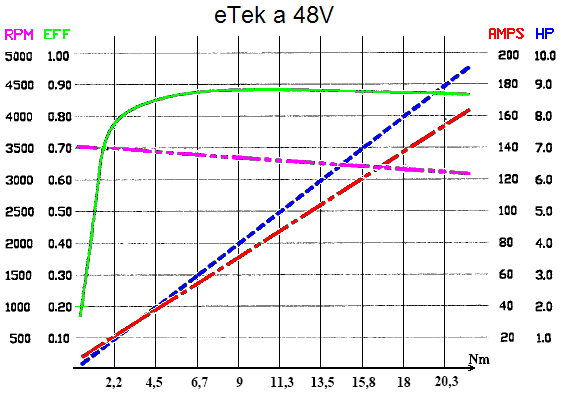
This is the performance curve you are referencing.
Unfortunately this curve does not show a wide range of rpm. It shows a steady voltage increasing torque curve for visualization of steady state operation at 48v. The x-axis represents torque not speed. The purple line which represents rpm starts at 3500 and slowly decreases to 3000 as torque increases. The efficiency line on this graph actually is showing us that as load is reduced, motor efficiency also drops because most of the power consumed is being used to overcome the internal friction, conductor resistance, and other such things just to keep the motor spinning. More important to me is the red line which shows that for a given voltage, amperage and therefore wattage will increase proportional to torque. To me this graph shows two things. One: to keep an electric motor in its most efficient operating zone we need to control the load applied. And Two: running at the lowest torque that is inside this range is ideal for keeping amperage low.
Simply running the tallest gearing that the motor can handle might seem intuitive, but it is exactly the opposite. Brammo's problem is that they started with a feasible single reduction gearing and geared down for better accelleration. Whereas if you look at a properly designed transmission, you start with a reduction which allows for acceptable acceleration then gear up to increase top speed. This is why accelerating from a stop in second gear is not practical in any successful production vehicle.