12-09-2020, 03:18 AM
|
#21 (permalink)
|
|
Master EcoModder
Join Date: Aug 2012
Location: northwest of normal
Posts: 29,297
Thanks: 8,334
Thanked 9,092 Times in 7,509 Posts
|
I think I meant expen$ive. 
__________________
.
.Without freedom of speech we wouldn't know who all the idiots are. -- anonymous poster
___________________
.
.Impossible is just something we haven't done yet. -- Langley Outdoors Academy
|
|
|

|
 Today Today
|
|
|
|
 Other popular topics in this forum...
|
|
|
|
|
12-09-2020, 04:54 AM
|
#22 (permalink)
|
|
Banned
Join Date: Nov 2017
Location: Australia
Posts: 2,060
Thanks: 107
Thanked 1,608 Times in 1,137 Posts
|
Quote:
Originally Posted by freebeard

I think I meant expen$ive. |
Yes I have never seen a cheap switching manifold / scanivalve. However, this purely electronic gear is not cheap either! |
|
|
|
|
The Following User Says Thank You to JulianEdgar For This Useful Post:
|
|
|
12-09-2020, 08:37 PM
|
#23 (permalink)
|
|
Banned
Join Date: Nov 2017
Location: Australia
Posts: 2,060
Thanks: 107
Thanked 1,608 Times in 1,137 Posts
|
OK, BIG learning curve for me.
Firstly, I can't use the absolute readings because the measured pressures change with altitude! That is, changing in altitude by only 10 metres is a change of about 1 millibar - or no less than 100 Pascals! When you remember that the highest pressure I record on the Insight at a test speed of 80 km/h is about 300 Pascals, you can see that unless the road is dead-flat, large inaccuracies will be introduced. (And this would apply to an extent to my pressure tank reference approach - but at least there the pressure is reset before each run - and that run is unlikely to be up/down a large hill).
I spotted this altitude problem when I'd left my house with the stationary pressures all set to atmospheric (say, 955 millibars at my attitude and today's weather), but when I got to my test road they'd all changed, even when I was again stationary. I thought it must be drift in the measurements (pretty surprising when such low drift is claimed) but when I got back home, all the pressures had returned to their initial setting.
So unless I reset the atmospheric pressure reading each time I get to the (flat) test road, this approach is not best.
I then tried the differential mode, referencing against the static port of the high, front-mounted pitot tube. But something wasn't right - as soon as I connected this hose, all the other readings altered. I then realised that the hose must be blocked, and so the reference pressure increased as I pushed the hose on. These hoses are tiny (0.9mm ID) and I was using one provided as a sample by Evolution Measurement. (The other hoses I bought.) I think the sample hose was closing-up, so I went to one of my silicone hoses for the pitot as well as the pressure puck. (Only using one puck at this stage.)
This all took a few hours (and more productive than arguing with Aerohead), but now I seem to have readings that make sense. My measured stagnation pressure on the Insight is 280 Pascals, versus the 290 I've measured previously. (If anyone wants to work it out, I am at 550 metres.)
Now I think I need 16 little reels to wind the hoses on (they are a nightmare to handle) and I am not sure that I'll have enough hose so I'll try to use just enough to allow transfer from car to car. I've labelled all the pucks and I'll do the same for the hoses, otherwise it would be easy to connect them out of order.
Finally, as expected, the fast response system with no smoothing dances around a bit - plus/minus 20 Pa at 290. I have asked Evolution Measurement if they can add adjustable smoothing, but no reply on that yet.
|
|
|
|
|
The Following User Says Thank You to JulianEdgar For This Useful Post:
|
|
|
12-09-2020, 11:37 PM
|
#24 (permalink)
|
|
Banned
Join Date: Nov 2017
Location: Australia
Posts: 2,060
Thanks: 107
Thanked 1,608 Times in 1,137 Posts
|
I have now done a two-way run on my Insight with 14 pressure taps plus the pitot tube static pressure reference. It's a lot of work to fit all the taps and ensure each is connected to the right port! All taps except #14 just offset from centerline.
Tap 1 - Front undertray
Tap 2 - Stagnation (number plate)
Tap 3 - Leading edge of bonnet
Tap 4 - Trailing edge of bonnet
Tap 5 - Centre windscreen
Tap 6 - Leading edge of roof
Tap 7 - Middle of roof
Tap 8 - Trailing edge of roof
Tap 9 - Centre rear glass
Tap 10 - Lower third rear glass
Tap 11 - Centre of ducktail spoiler
Tap 12 - Wake (centre of bumper)
Tap 13 - Rear diffuser
Tap 14 - Centre side undertray
Tap 15 - Cabin (not connected)
Tap 16 - Static port of pitot tube (ie ref pressure)
I did a screen grab of each run:
Going north:

Going south:

Note the variation in the unfiltered signals.
Three pressures varied greatly on the different runs - trailing edge of bonnet (#4), centre of the windscreen (#5) and centre of ducktail spoiler (#11). I assume there was plenty of yaw airflow - day is quite gusty (up to 30 km/h).
Averaged pressures:

These largely agree with what I have measured previously - while there are some variations in values, the pattern is as before.
But I urgently need averaged values rather than the 'snapshot value' at the time I do the screen grab. I can log a run and then average in Excel, but I'd much rather the software had selectable smoothing. I might try logging and averaging tomorrow - logging was a bit fiddly when I experimented on my desktop PC, so it might be hard in a moving car!
Last edited by JulianEdgar; 12-09-2020 at 11:47 PM..
|
|
|
|
|
The Following 3 Users Say Thank You to JulianEdgar For This Useful Post:
|
|
|
12-10-2020, 12:15 AM
|
#25 (permalink)
|
|
Moderator
Join Date: Feb 2012
Location: Urbana, IL
Posts: 1,939
Thanks: 199
Thanked 1,807 Times in 943 Posts
|
Interesting that when the stagnation pressure reaches its peak, the pressure at the roof leading edge (and now that I look more closely, the other two roof locations) reaches its minimum and vice versa. I wonder what's going on there?
|
|
|
|
|
12-10-2020, 12:30 AM
|
#26 (permalink)
|
|
Banned
Join Date: Nov 2017
Location: Australia
Posts: 2,060
Thanks: 107
Thanked 1,608 Times in 1,137 Posts
|
Quote:
Originally Posted by Vman455
Interesting that when the stagnation pressure reaches its peak, the pressure at the roof leading edge (and now that I look more closely, the other two roof locations) reaches its minimum and vice versa. I wonder what's going on there?
|
Isn't that what you'd expect, though? Higher stagnation pressure = more effective airflow = greater pressure drop as more airflow wraps around those corners.
But I think that there will be lots to explore in terms of high-speed relationships - but at this stage, I just want averages! |
|
|
|
|
12-10-2020, 12:46 PM
|
#27 (permalink)
|
|
Moderator
Join Date: Feb 2012
Location: Urbana, IL
Posts: 1,939
Thanks: 199
Thanked 1,807 Times in 943 Posts
|
Quote:
Originally Posted by JulianEdgar
Isn't that what you'd expect, though? Higher stagnation pressure = more effective airflow = greater pressure drop as more airflow wraps around those corners.
|
Yes, I was thinking about it more last night. Higher stagnation pressure from change in freestream speed --> faster flow over the roof. I'll be curious to see what this looks like on a less windy day. |
|
|
|
|
12-10-2020, 07:23 PM
|
#28 (permalink)
|
|
Banned
Join Date: Nov 2017
Location: Australia
Posts: 2,060
Thanks: 107
Thanked 1,608 Times in 1,137 Posts
|
Last edited by JulianEdgar; 12-10-2020 at 08:41 PM..
|
|
|
|
|
The Following 2 Users Say Thank You to JulianEdgar For This Useful Post:
|
|
|
12-10-2020, 09:29 PM
|
#29 (permalink)
|
|
Master EcoModder
Join Date: Aug 2012
Location: northwest of normal
Posts: 29,297
Thanks: 8,334
Thanked 9,092 Times in 7,509 Posts
|
It might be interesting to put pucks on either side of [one of] the vertical fins.
__________________
.
.Without freedom of speech we wouldn't know who all the idiots are. -- anonymous poster
___________________
.
.Impossible is just something we haven't done yet. -- Langley Outdoors Academy
|
|
|
|
|
12-10-2020, 10:06 PM
|
#30 (permalink)
|
|
Banned
Join Date: Nov 2017
Location: Australia
Posts: 2,060
Thanks: 107
Thanked 1,608 Times in 1,137 Posts
|

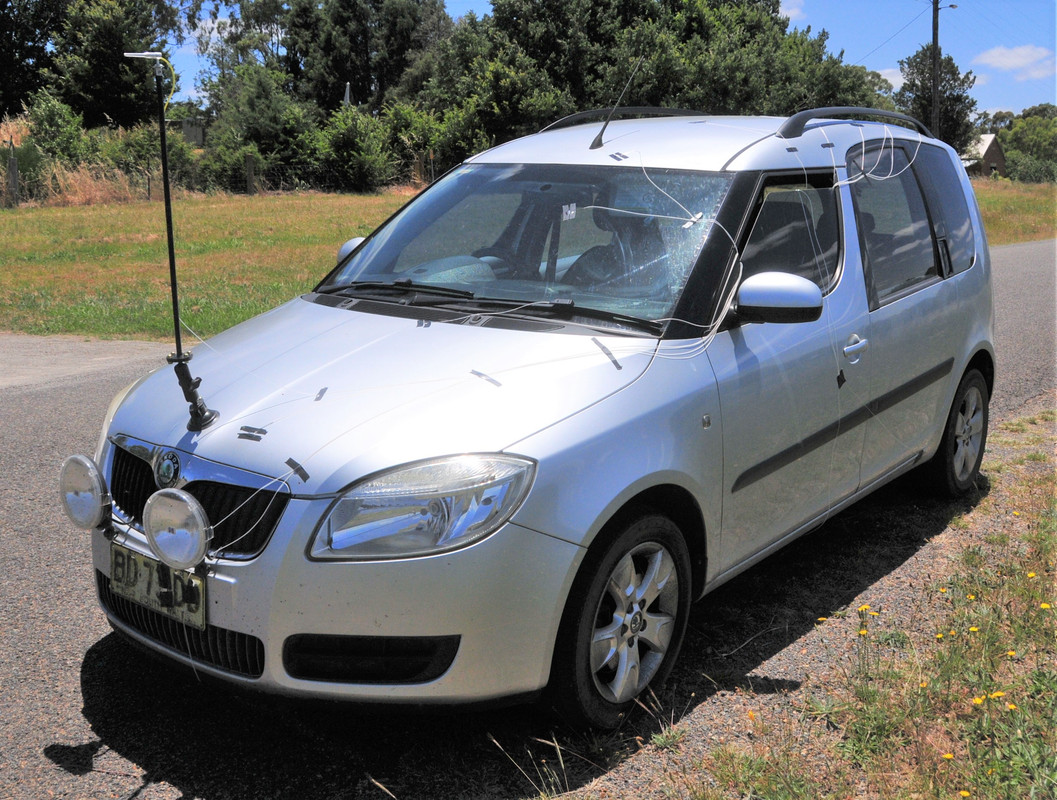
Our Skoda Roomster - the day before it goes to its new owner!
A few comments.
The very low pressure under the front undertray would be over only a small area - the puck was placed at the point where the undertray has a short projecting downwards curve. The low pressures under the rest of the car reflect that it's not that untidy underneath - the front undertray, some side undertrays and a spare wheel well that's at a similar height.
The -220 Pascals on the roof is a mystery to me. I rechecked the data and that's definitely the average of what was logged. Looking at the logged pressures, this tap varied a lot more in pressures than the others on the roof. If we were keeping the car, it might be interesting to tape up the roof rails. I've also not tuft tested this car - perhaps tufts might show something. Maybe A-pillar vortices interacting with yaw airflow across the roof rails - but that's just a complete guess.
The increase in pressure at the back of the roof (ie it is not as low) is probably caused by the flattening of the roof - it's not quite a spoiler but the roof stops dropping away.
The two pressures measured in the wake are basically the same.
|
|
|
|
|