04-15-2013, 04:24 AM
|
#731 (permalink)
|
|
The PRC.
Join Date: Oct 2009
Location: Elsewhere.
Posts: 5,304
Thanks: 285
Thanked 536 Times in 384 Posts
|
Quote:
Originally Posted by jamesqf

I don't quite get it. The "big melt" described in that article does show up on the reconstruction graph, and it's only a fraction of the melting observed today.
|
There's a wiggle but its all be smoothed out.
Quote:
Originally Posted by jamesqf
Seems obvious to me. There is a period of time for which they have both satellite observations and the data from which the reconstruction was done. The satellite observations are overlaid on the graph to show that for that period, the reconstruction is a very good match to satellite data.
|
Satelites starts in 1979, observations start well before that on that graph. Observations pre-war would not include Aircraft (much), or radar (still a military secret) or satelites. Just ships and observations from people in the area.
And they should match because those observations are used to calibrate the "models" - remember, measure x vs y, create relationship, verify against another period of x vs y... Tapping of which
Quote:
Originally Posted by NeilBlanchard
We have a way to measure the extent of ice, and as I understand it, it has to do with the different way sediments on the ocean bottom collect under the ice and under open water.
The melting now is unprecedented in recorded history. If all the ice melts in the summer, then that is the first time in like a million years or more that this has happened.
Edit: here's the Danish map from August 1923: http://brunnur.vedur.is/pub/trausti/...23/1923_08.pdf. |
The captions on the top, right of the map show how it was done - over time. Today a satelite can do a snapshot which is how we get day by day charts and figures. This map was made up of observations probably over a whole season - look at the day to day stats from last years melt - how fast the measurements went down when the ice broke up from the storm, and how fast it recovered when the broken ice refroze into detectable pieces. All inside of a single season.
We can detect this today, it was much harder then.
So we have 3 sets of figures
- Modern satelites
- "Observations" pre satelites - probably aircraft and radar post WW2, pre WW2 ships and reports (the red spots on the map above)
- Reconstructions beforehand
Quote:
Originally Posted by NeilBlanchard
If the drought continues or reoccurs soon, it will be due to climate change. This may be a matter of semantics, though.
|
ThinkProgress say "WE'RE DOOMED", NOAA says "Nothing to do AGW".
__________________
[I]So long and thanks for all the fish.[/I]
|
|
|
|
 Today Today
|
|
|
|
 Other popular topics in this forum...
|
|
|
|
|
04-15-2013, 11:42 AM
|
#732 (permalink)
|
|
Master EcoModder
Join Date: May 2008
Location: Maynard, MA Eaarth
Posts: 7,908
Thanks: 3,475
Thanked 2,953 Times in 1,846 Posts
|
The bottom line is, the 2012 melt season was stunning even in comparison to 2007. And 2007 was itself stunning in relation to the earlier melt seasons.
And folks, the ice *area* is not the most important thing, but the *volume* of ice is the most important. The area now is made up largely by very thin and fragile ice, and when the ice melts it has large effects in things like salinity - so it refreezes at higher temperatures than previously. But thin and fragile ice is prone to being broken up and broken ice tends to melt faster.
The volume of ice is ONE FIFTH of what it was in 1985:
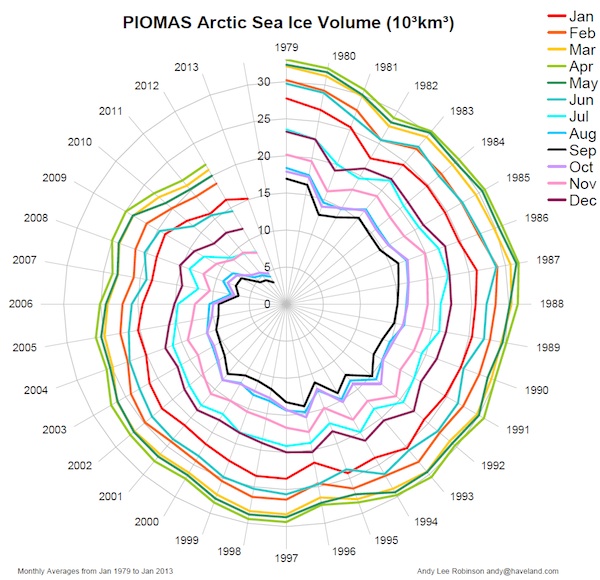
(click on image for link) |
|
|
|
|
04-15-2013, 01:44 PM
|
#733 (permalink)
|
|
The PRC.
Join Date: Oct 2009
Location: Elsewhere.
Posts: 5,304
Thanks: 285
Thanked 536 Times in 384 Posts
|
Could you update this to include 1938, 1923, 1911, 1897 and 1635 please.
__________________
[I]So long and thanks for all the fish.[/I]
|
|
|
|
|
04-15-2013, 02:13 PM
|
#734 (permalink)
|
|
The PRC.
Join Date: Oct 2009
Location: Elsewhere.
Posts: 5,304
Thanks: 285
Thanked 536 Times in 384 Posts
|
These have always been very interesting graphs and datasets - science money very well spent. Here is the PIOMAS graph for ice volume year on year - note how we get this day by day as described above...

This doesn't exist for 1923 or 1938 or any year prior to 1979.
But interesting questions all the same - will the projections for volume match the measured volume, will it climb over a previous year or sink back again. Will Dan Dare, pilot of the future, save Digby from the evil Mekon - tune in... 
How about thickness - despite the "record melt" it is back to 2012 "pre summer melt" levels and climbing - again PIOMAS here.

What about extent, well here we have JAXA measurement for extent again year on year - so all the graphs are similar.

JAXA has extent higher than previous years which if the "record melt" was storm related would make sense - the disparate ice forms a wider ice area.
And another question - if volume is (essentially) thickness x extent - I wonder if 2013 will be a low year or maybe not given the NH "record cold" temps so far - it's May and it was only 15 Deg C outside here on Saturday.
However these graphs are great but...
__________________
[I]So long and thanks for all the fish.[/I]
|
|
|
|
|
04-15-2013, 02:27 PM
|
#735 (permalink)
|
|
The PRC.
Join Date: Oct 2009
Location: Elsewhere.
Posts: 5,304
Thanks: 285
Thanked 536 Times in 384 Posts
|
...what about reconstructions.
Reconstructions come from many source "proxies". Basically you find something which is captured and stored over time - ice cores, tree rings, lake sediments, even coral remains were used a few years ago.
The problem with these is that you get (at best) maybe a seasonal measurement, or an annual one, or maybe less than that.
Lake sediments can give you 2 measurements a year - a summer and a winter layer. These layers can be checked in terms of pollen and other samples to gauge what was happening at the time. Lake sediments are very delicate though - the top few layers will be disturbed by extraction and dating thereafter is an issue.
Ice cores tend to be once a year - you have a cycle of warm melt in spring summer, followed by snowfall and then freezing in winter, and then repeated. Lower ice cores can be compressed so much that the dating becomes more difficult the deeper (and further back) you go - so your deep sample is not one year but maybe at best one in 20, one in 100, one in 300, one in 500. Any extremes in that 20, 100, 300, 500 years is "averaged" out.
Tree rings are notoriously good and bad - every tree gets a new ring each year so cutting into one and measuring the rings and their widths should tell you (for example) temperature. And of course you can date this easily because the outermost ring is ~ 1 year old and you count in.
But there are problems. Firstly is your tree only affected by x (x being temp, or CO2, or something else) - or is something else affecting it's growth ? Did you pick the right tree - one not on the top of the tree line ? Did you sample from the correct side - trees have different growth patterns into the sun and away from it. And also did you isolate it from other plant life around, or maybe a tree bug or parasite - would you be able to detect this.
Even if you have what you might think is a perfect reconstruction you have to caveat it with doubts as outlined above, all are valid.
So lets see an example...
__________________
[I]So long and thanks for all the fish.[/I]
|
|
|
|
|
04-15-2013, 02:40 PM
|
#736 (permalink)
|
|
The PRC.
Join Date: Oct 2009
Location: Elsewhere.
Posts: 5,304
Thanks: 285
Thanked 536 Times in 384 Posts
|
...Hide the Decline. Yeah I know, another "denier" meme - but work with me here.
The phrase "Hide the Decline" has often been linked to the pause in warming temps - not so. It actually relates to this reconstruction of temps from trees by Keith Briffa of CRU - where those leaked / hacked emails came from. This is what it looked like.
Note the bit at the end where the temps fell away.
How come ? Temps are rising, how come the trees are not reflecting it ? Could it be due to some other factor ?
And the key question is - can we be sure the reconstruction is sound or not in some way affected by this and we can't detect it ?
This is how the data appeared when put together with other data by the IPCC (Briffa was lead author - hang on, lead author reviewing who's work ?)
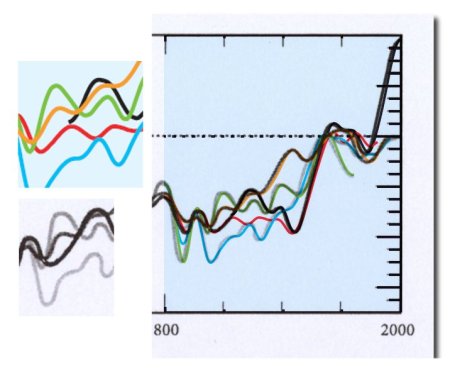
Why does the red line stop before 2000 when the data in the other graph goes on to 2000 ?
You may decide this is a question similar to "how many fairies can dance on the head of a pin" but if you are going to attempt to effectively reconstruct the world economy to try and prevent this the evidence has to be better.
But...
__________________
[I]So long and thanks for all the fish.[/I]
|
|
|
|
|
04-15-2013, 02:43 PM
|
#737 (permalink)
|
|
The PRC.
Join Date: Oct 2009
Location: Elsewhere.
Posts: 5,304
Thanks: 285
Thanked 536 Times in 384 Posts
|
...Hide the decline is contentious.
Fundamentally though if you have real, live, hour by hour data with spikes, extremes, anomalies and other variances - grafting this onto data where you are making a guess (reconstructions) and where you have data from maybe some randome sources (observations) and at a low resolution (twice a year to maybe once every 500 years) and even then you make a lot of assumptions that the data is correct - is not exactly comparing Granny Smiths with other Granny Smiths.
__________________
[I]So long and thanks for all the fish.[/I]
|
|
|
|
|
04-15-2013, 07:11 PM
|
#738 (permalink)
|
|
Master EcoModder
Join Date: May 2008
Location: Maynard, MA Eaarth
Posts: 7,908
Thanks: 3,475
Thanked 2,953 Times in 1,846 Posts
|
I believe that the "hide the decline" phrase is in reference to a known anomaly in tree ring data that is a proxy for temperatures, that we have concurrent thermometer data for, as well? I may not be correct, but that is my recollection.
|
|
|
|
|
04-15-2013, 10:35 PM
|
#739 (permalink)
|
|
Master EcoModder
Join Date: Jun 2008
Location: Earth
Posts: 5,209
Thanks: 225
Thanked 812 Times in 595 Posts
|
Quote:
Originally Posted by Arragonis
...what about reconstructions.
Reconstructions come from many source "proxies". Basically you find something which is captured and stored over time - ice cores, tree rings, lake sediments, even coral remains were used a few years ago.
The problem with these is that you get (at best) maybe a seasonal measurement, or an annual one, or maybe less than that.
|
And so? Point here is that the reconstructions, taken all together, are the best information we have. That information - from many different and unrelated sources - is pretty much all giving us the same picture, and that picture matches what is predicted from physics and observed CO2 increases.
What you seem to be saying is that we should just ignore all the reconstructions (and the physics) because you don't like the conclusions people draw from them. This is apparently because you (along with a lot of other like-minded folks lumped under that term you so dislike) have the (utterly mistaken, IMHO) belief that the contemporary western lifestyle represents the best of all possible worlds, so anything that threatens to upset the status quo must be silenced. |
|
|
|
|
04-16-2013, 05:29 AM
|
#740 (permalink)
|
|
The PRC.
Join Date: Oct 2009
Location: Elsewhere.
Posts: 5,304
Thanks: 285
Thanked 536 Times in 384 Posts
|
Quote:
Originally Posted by NeilBlanchard
I believe that the "hide the decline" phrase is in reference to a known anomaly in tree ring data that is a proxy for temperatures, that we have concurrent thermometer data for, as well? I may not be correct, but that is my recollection.
|
Yep. And the fact that the reconstruction doesn't match reliable instrument data leads automatically to questions about whether it has happened before during the reconstructed period, and if so why ? Also are those divergencies enough to devalue the reconstruction ?
Its worth noting for balance the reconstruction which did diverge has since moved back closer to the instrumental temps suggesting an external factor not yet isolated.
Quote:
Originally Posted by jamesqf
And so? Point here is that the reconstructions, taken all together, are the best information we have. That information - from many different and unrelated sources - is pretty much all giving us the same picture, and that picture matches what is predicted from physics and observed CO2 increases.
|
So why were the tree rings highlighted diverging ? Are you stating that this could never have happened before during the period reconstructed ? How do you know ?
Quote:
Originally Posted by jamesqf
What you seem to be saying is that we should just ignore all the reconstructions (and the physics) because you don't like the conclusions people draw from them.
|
Absolutely not, but they can be compared to historical records as a verification - the MWP, LIA, RWP etc. Some show the MWP, some do not, some show it as a local thing, some as a worldwide thing and some as a worldwide thing but not at the same time - so use them but acknowledge the uncertainties.
Also when selecting which ones to use clearly identify why some archives are included and others are specifically excluded.
Use standard maths methods like PCA and don't make up some other kind of PCA which is not recognised by statisticians.
And finally include your verification stats.
Quote:
Originally Posted by jamesqf
This is apparently because you (along with a lot of other like-minded folks lumped under that term you so dislike) have the (utterly mistaken, IMHO) belief that the contemporary western lifestyle represents the best of all possible worlds, so anything that threatens to upset the status quo must be silenced.
|
")
__________________
[I]So long and thanks for all the fish.[/I]
|
|
|
|
|